Key Takeaways:
- Industry average rental rates hit $350 per event with pricing models ranging from cost-plus ($280-$400) to value-based premium ($350-$550).
- Peak summer season generates $4,000 monthly at $400 average rates with 83% utilization, while winter requires $300 rates at 25% utilization.
- Contribution margin spans $252-$352 per event after $98 average variable costs, enabling 393% first-year ROI with strategic pricing.
- Add-on services deliver 60-95% profit margins, including delivery ($50-$150), attendants ($25-$50/hour), and wet configuration premiums ($50-$100).
- Annual rate increases of 5-7% align with market growth driven by 7.2% industry CAGR, 35% post-pandemic booking surge, and updated 2024-2025 insurance requirements.
Pricing determines profitability, market position, and business sustainability in party rentals. Setting rates too low leaves money on the table, while pricing too high reduces booking frequency. A strategic approach balances cost recovery, competitive positioning, and value perception. This guide provides actionable frameworks for establishing profitable rates that attract customers and support long-term growth.
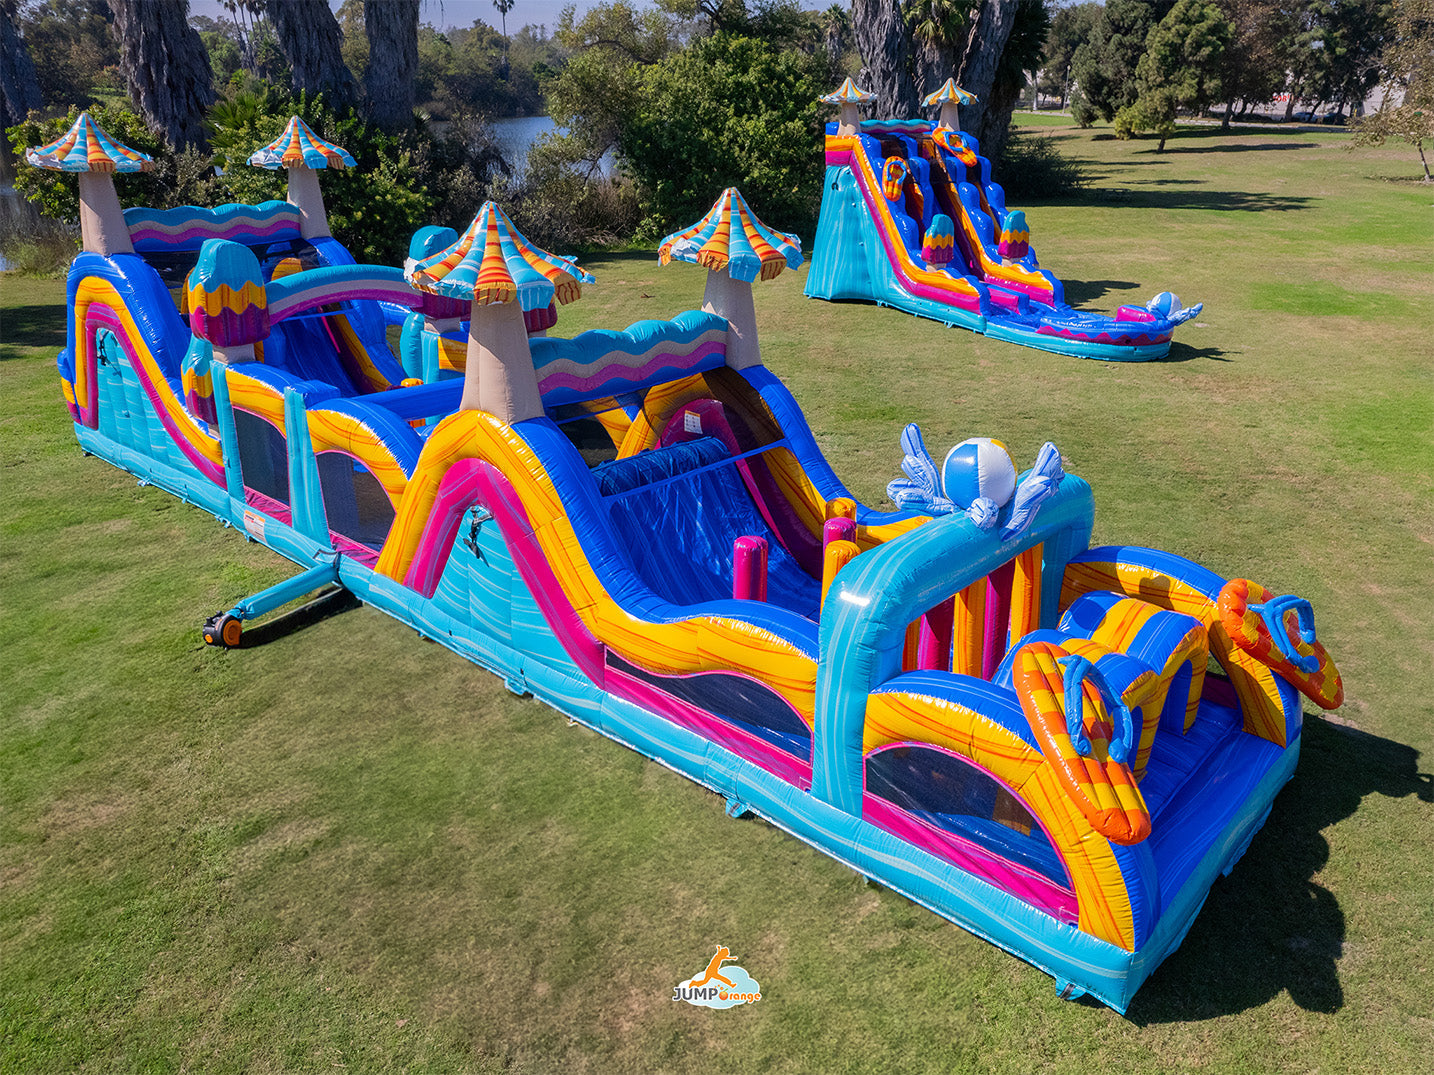
What Makes a 40 ft Inflatable Obstacle Course a Premium Rental Asset?
Premium positioning starts with understanding what separates commercial-grade equipment from residential alternatives. Long-lasting blow up obstacle courses with superior size, materials, safety certifications, and visual impact justify higher pricing. These factors create competitive advantages that convert inquiries into bookings without price negotiation.
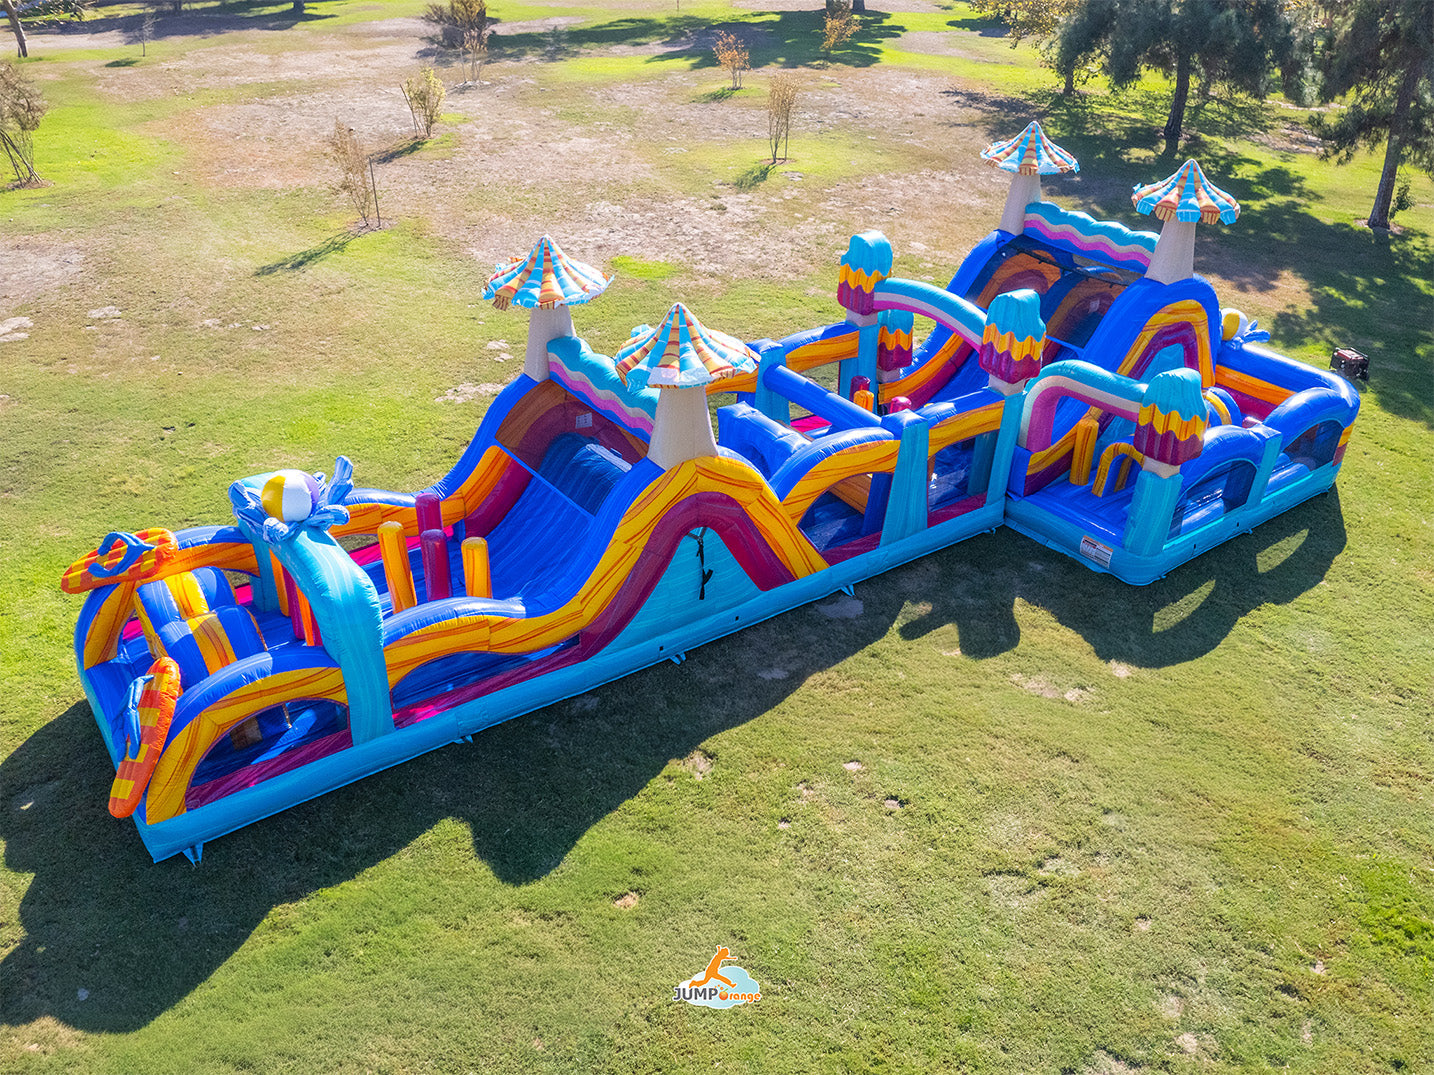
What defines a 40 ft obstacle course in commercial rental terms?
Obstacle courses require 20-25 sq ft of storage space with defined operational characteristics. Setup takes 20 minutes compared to 10 minutes for 13x13 bounce houses or 15 minutes for 20ft courses. Breakdown runs 15-20 minutes. These units book 72 events yearly at moderate utilization versus 80 for bounce houses, 70 for 20ft courses, or only 40 for 60ft+ units.
How do materials, safety standards, and design complexity justify higher pricing?
Commercial-grade construction uses 15 oz reinforced vinyl versus competitors' 13 oz materials. Heat-sealed seams prevent splitting under pressure. Commercial-grade PVC materials ensure durability through extended use. UL-listed blowers and safety certifications meet insurance requirements. Material innovations from 2023-2025 further improve performance. These units last 5 years under regular rental use compared to residential units, breaking within 18 months.
Why does its scale and visual impact drive premium demand across event types?
Professional equipment creates immediate "wow" reactions, establishing a competitive advantage. Quality presentation eliminates price negotiation—customers book on the spot. Unique designs that competitors lack drive specific requests by name. Multiple challenge elements, including climbing walls, tunnels, and slides, justify premium pricing through enhanced entertainment value.
How does owning a 40 ft course position a rental business competitively in the market?
Revenue per dollar invested hits $7.20, matching 20ft courses and outperforming 60ft+ mega obstacles at $3.80. This represents the sweet spot balancing ROI with manageable market saturation. Annual revenue potential reaches $25,200 at moderate utilization, providing substantial income from a single unit.
Why Does Pricing Strategy Matter for High-Value Inflatables?
Strategic pricing directly impacts return on investment, cash flow, and competitive positioning. Understanding financial mechanics prevents underpricing that erodes profitability. Customer psychology and safety perceptions influence willingness to pay premium rates for quality equipment.
How can pricing directly affect ROI and equipment lifespan?
First-year ROI averages 393% under moderate booking scenarios. Breakeven occurs in 6-8 months under moderate to premium pricing strategies. Profit margins run 30-40%, significantly exceeding general party rental margins of 15-25%. Proper pricing enables faster equipment replacement and inventory expansion.
Why does underpricing erode profitability for startup rental businesses?
Contribution margin spans $252-$352 per event after variable costs. Industry average first-year revenue hits $73,000 for well-executed operations. Total variable costs per event run $74-$122, averaging $98. Underpricing below cost recovery thresholds creates unsustainable business models that fail during slow seasons.
What customer psychology drives willingness to pay for larger inflatables?
Professional equipment prevents reputation damage from equipment failures that plague budget operators. Quality units stop the loss of bookings to competitors with superior-looking inflatables. Satisfied customers eliminate price negotiation, booking immediately upon seeing professional setups rather than shopping for lower prices.
How do perceived quality and safety influence price acceptance?
Commercial-grade safety certifications protect businesses from liability issues while signaling quality to customers. Professional brand protection: "My business reputation is worth more than the $1,500 I save buying cheap equipment." Peace of mind investment: "When a potential customer sees my professional setup, they don't negotiate price—they just book."
What Core Factors Determine the Base Rental Rate?
Base rates must cover equipment costs, operational expenses, and target profit margins while remaining competitive. Regional demand, event types, and equipment features create pricing tiers. Understanding these factors prevents underpricing that damages profitability or overpricing that reduces booking frequency.
How should initial pricing reflect product cost, durability, and warranty coverage?
Equipment costs vary by manufacturer: BounceWave at $2,495 (sale price), Magic Jump at $3,499 (with customization), Tent and Table at $4,300 (premium), and XJUMP at $3,500-$3,700 (estimated). Total investment with essentials ranges $3,200-$5,000, depending on manufacturer selection. Warranties of 3+ years signal manufacturer confidence. Five-year warranties provide peace of mind throughout primary revenue-generating periods, justifying premium pricing that recovers initial investment within 6-8 months.
What role do regional demand and event frequency play in pricing variation?
Primary markets focus on suburban and growing metropolitan areas with dense family populations. Sun Belt states—Texas, Florida, Arizona, Georgia, and North Carolina—offer year-round outdoor events generating consistent income. Family-dense suburbs like Northern Virginia, Orange County, CA, and suburbs of Dallas, Atlanta, and Phoenix feature high disposable income plus competitive party culture supporting premium pricing.
How do event types (school fairs, corporate events, fundraisers) shape pricing tiers?
School events and graduations drive spring demand at moderate pricing. Birthday parties dominate the peak summer season at premium rates. Community festivals and fall events maintain steady bookings through autumn. Corporate events show 55% year-over-year growth, commanding the highest pricing tiers. Holiday parties and indoor events represent lowest winter demand, requiring adjusted rates to maintain utilization.
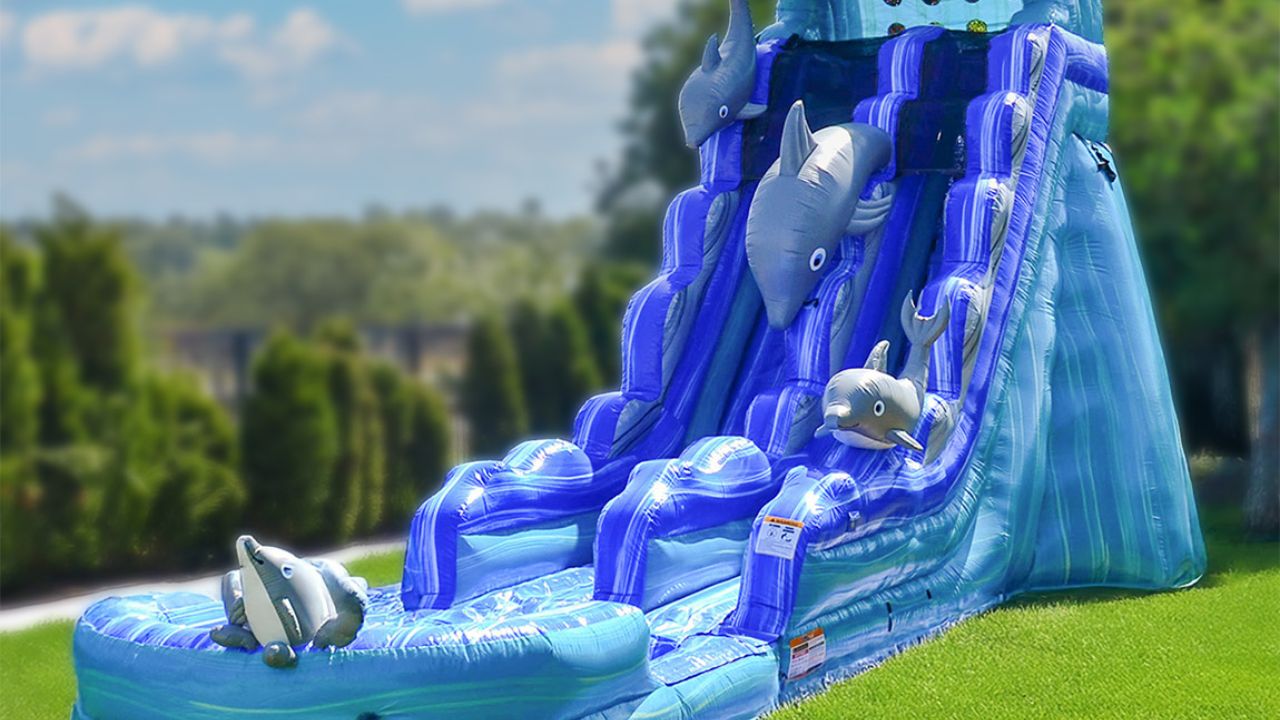
When does theme design or wet/dry capability justify higher rates?
Dual-use wet/dry configuration adds $200 in equipment costs but commands 15-20% revenue premiums. Wet configuration adds $50-$100 per event above dry-only pricing. Exclusive themes that competitors can't replicate justify premium positioning. Quick-deflation technology enables faster turnarounds between events, maximizing daily booking potential and supporting higher per-event rates.
How Can Entrepreneurs Calculate a Sustainable Price Floor?
Price floors establish minimum rates covering all costs while generating target profit margins. Understanding breakeven points prevents underpricing during competitive pressures. Accurate cost allocation across fixed and variable expenses ensures long-term sustainability.
What are the essential cost components to include in rate planning?
Budget setups at $3,500 investment require 23.5 events in Year 1 to break even over 6 months. Mid-range setups at $4,800 need 28.7 events over 8 months to reach breakeven. Premium setups at $5,800 break even in 23.4 events over 6 months through premium pricing strategies. These calculations determine minimum pricing thresholds for profitability.
How can cleaning, maintenance, and storage costs be allocated per rental?
Warehouse storage costs $240-$2,400 annually based on monthly rates of $20-$200, averaging $1,320 yearly. Maintenance and repairs require $100-$300 annually, averaging $200 for cleaning supplies and repair kits. Regular maintenance prevents reputation damage from equipment issues during client events. Divide annual fixed costs by projected bookings to determine per-rental allocation.
What insurance, staffing, and transport expenses belong in the baseline calculation?
General liability insurance runs $300-$1,500 annually, with $900 representing typical coverage. Setup requires a 3-person crew for 3 hours total, costing $54-$72 per event in labor expenses. Transportation and fuel run $20-$50 per event, averaging $35 based on distance. Total annual fixed costs span $640-$4,200, with $2,420 representing typical operations that must be recovered through rental rates.
How do warranty repairs and replacement cycles affect pricing over time?
Commercial-grade units last 5 years under regular rental use, establishing depreciation timelines. Budget residential units break within 18 months, requiring premature reinvestment. Proper cleaning and complete drying prevent seam splits requiring constant patching. Neglecting these procedures renders equipment unusable within 18 months instead of achieving a 5-year lifespan, dramatically impacting the total cost of ownership that pricing must recover.
What Pricing Models Work Best for Large Inflatables?
Different pricing models serve distinct market strategies and operational goals. Cost-plus ensures profitability but may miss revenue opportunities. Competitive pricing maintains market alignment while value-based pricing maximizes margins. Dynamic pricing optimizes utilization across demand fluctuations.
How do cost-plus, competitive, and value-based models differ for inflatables?
Cost-Plus (30% margin): Weekday $280, Weekend $350, Peak Season $400, Wet Premium $50. Ensures profitability through simple calculations but may not capture the full market value.
Market-Based Competitive: Weekday $275, Weekend $375, Peak Season $450, Wet Premium $75. Market-aligned competitive positioning, but may leave money on the table during high-demand periods.
Value-Based Premium: Weekday $350, Weekend $450, Peak Season $550, Wet Premium $100. Maximizes revenue through premium brand positioning but requires strong marketing and may limit bookings.
Dynamic Pricing: Weekday $250, Weekend $400, Peak Season $500, Wet Premium $75. Optimizes revenue and fills low-demand periods, but complex to implement with customer confusion risks.
What are the pros and cons of hourly, daily, and weekend flat-rate pricing?
Conservative pricing starts at $275 per event for budget-conscious markets. Moderate market-based rates average $350 per event as the industry standard. Premium value-based pricing reaches $450 per event in affluent areas. Weekend rates typically run $350-$450. Extended rentals command $50-$100 per additional hour with 90%+ profit margins, making hourly extensions highly profitable add-ons to flat-rate base pricing.
How does dynamic pricing respond to seasonal spikes and regional events?
Dynamic pricing spans $250-$500 depending on real-time demand fluctuations. Peak season rates reach $400-$550 during high-demand periods. Average utilization of 1.5 rentals weekly provides a baseline for capacity-based pricing adjustments. Dynamic models increase rates when booking velocity accelerates and decrease rates during slow periods to maintain utilization targets.
Why do bundled and package-based pricing models increase booking conversions?
Package deals offering 10-20% discounts maintain 25-35% profit margins while increasing per-event value. Multiple units or add-ons boost transaction size without proportional cost increases. Digital marketing integration commands a 23% premium for tech-enabled rental operations featuring online booking, digital contracts, and customer communications.
How Do Seasonality and Event Demand Shape Pricing Strategy?
Seasonal patterns create predictable demand fluctuations requiring rate adjustments. Peak summer months support premium pricing while winter requires strategic discounting. Understanding regional climate variations and event calendars optimizes year-round profitability.
Which months and climates deliver peak rental seasons in the U.S.?
Summer (June-August) represents peak season with 10 events monthly at 83% utilization. The average rate of $400 generates $4,000 monthly revenue. Configuration shifts to 30% dry, 70% wet for water-based events. Post-pandemic bookings increased 35%, extending peak season demand.
Spring (March-May) delivers 6 events monthly at 50% utilization. The average rate of $350 generates $2,100 monthly revenue. Configuration splits 60% dry, 40% wet for graduation season and spring festivals.
How can entrepreneurs adjust pricing during off-season months to maintain cash flow?
Fall (September-November) produces 5 events monthly at 42% utilization. Average rate of $325 yields $1,625 monthly revenue. Configuration returns to 70% dry, 30% wet for back-to-school events.
Winter (December-February) delivers 3 events monthly at 25% utilization, marking the lowest demand. The average rate of $300 generates $900 monthly revenue. Configuration runs 95% dry, 5% wet for holiday and indoor events. Strategic discounting of 15-20% during winter maintains minimum utilization while covering fixed costs.
Why should event-driven adjustments (holidays, fairs, school openings) guide your rate card?
Seasonal buyers order January-March for summer launches, signaling planning cycles. School events and graduations drive spring pricing premiums. Community festivals and fall events support steady autumn rates. Corporate event market growth of 55% year-over-year creates expanding opportunities for premium weekday pricing during business hours.
How do weekday vs. weekend pricing structures balance inventory utilization?
Average rental rates of $350 per event exceed bounce houses at $150 or 20ft courses at $225. Weekday rates typically run $250-$350, discounted 20-30% to fill mid-week availability. Weekend rates hit $350-$450, capturing peak demand premiums. Peak season rates reach $400-$550 during holiday weekends and summer months, maximizing revenue during the highest-demand periods.
What Add-On and Logistics Costs Should Be Billed Separately?
Transparent pricing for delivery, setup, and additional services protects profit margins. Line-item charges prevent scope creep and accurately reflect actual costs. Strategic add-on pricing turns logistical necessities into profit centers while maintaining competitive base rates.
How should delivery zones and travel distance affect your quote?
Delivery and setup fees of $50-$150 carry 60-80% profit margins as value-added services. Transportation and fuel run $20-$50 per event, averaging $35 based on actual distance traveled. Standard offerings use distance-based pricing with zone rates: within 10 miles included, 10-20 miles add $50, 20-30 miles add $100, beyond 30 miles requires custom quotes.
Why should setup labor and teardown time appear as transparent line items?
Setup takes 20 minutes while breakdown runs 15-20 minutes under normal conditions. Setup requires a 3-person crew for 3 hours total, including travel time, costing $54-$72 per event in labor expenses. Transparent labor charges prevent disputes while recovering actual costs that customers understand when itemized separately from equipment rental rates.
When do generators, tarps, and attendants merit additional fees?
Essential accessories like stakes, tarps, and sandbags cost $300-$800 initially but depreciate across multiple uses. Attendant service at $25-$50 hourly delivers 40-60% profit margins for events requiring supervision. Wet-only configuration requires $50 additional equipment for water hookup. Dual-use wet/dry configuration adds $200 in equipment costs, justifying separate charges for water-based features.
How can cleaning and sanitation charges maintain margins while signaling quality?
Damage waivers of $25-$50 provide 95%+ profit margins while offering customer peace of mind. Maintenance and repairs cost $100-$300 annually, averaging $200 across all rentals. Proper cleaning prevents seam splits requiring constant patching. Itemized cleaning fees of $25-$35 per rental signal quality standards while recovering actual sanitation costs that maintain equipment condition and warranty eligibility.
What Discounts and Promotions Increase Bookings Without Undervaluing the Product?
Strategic discounting drives bookings during slow periods without establishing unsustainable price expectations. Multi-unit deals encourage larger transactions. Loyalty programs build repeat business while maintaining price integrity. Community partnerships generate visibility worth more than lost margin.
When are multi-unit or repeat-customer discounts most effective?
Growth-mode operators add 2-5 new units annually, creating package opportunities. Proven operations spanning 1-5 years generate $25,000-$150,000 annual revenue through strategic bundling. Package deals offering 10-20% discounts maintain 25-35% profit margins while increasing total transaction value. Repeat customer discounts of 10% after three bookings build loyalty without establishing discount expectations for new customers.
How can weekday or off-peak pricing boost utilization rates?
Fall utilization drops to 42% with 5 events monthly. Winter hits 25% utilization with only 3 events monthly, representing the lowest annual demand. Spring delivers 50% utilization with 6 events monthly. Weekday discounts of 20-30% fill otherwise idle inventory during school and work hours, improving overall capacity utilization while maintaining weekend premium pricing.
What is the strategic difference between early-bird and loyalty discounts?
Relationship-driven service appeals to detail-oriented buyers who research extensively. Communities of successful rental operators provide peer support and best practice sharing. Parents specifically request certain bounce house businesses by name based on previous positive experiences. Word-of-mouth marketing: "You're the bounce house lady! My daughter still talks about her party!" Early-bird discounts of 15% for 30+ day advance bookings improve cash flow forecasting, while loyalty programs reward repeat customers without training new customers to expect discounts.
How do community partnerships and nonprofit events affect long-term brand visibility?
Customer success stories and case studies build credibility with prospective clients. Community recognition creates local celebrity status among families planning events. Primary customer values include community impact—wanting to bring joy to neighborhood kids and families. Military communities represent tight-knit markets supporting local businesses. Nonprofit discounts of 20-25% generate visibility worth multiples of lost margin through community goodwill and referral generation.
How Do Competitor Benchmarks and Market Research Inform Pricing?
Market intelligence prevents both underpricing and overpricing relative to local competition. Understanding competitor positioning reveals market gaps for differentiation. Imported equipment pricing should not dictate domestic rates due to quality and regulatory differences.
How can new owners identify local and regional price averages?
Call 3-5 local competitors posing as customers to check current pricing. Attend local events, observing different equipment in action and noting rental rates advertised. Create detailed comparison charts of specifications, prices, and warranties across competitors. New buyers research extensively for 3-6 months before purchasing, gathering comprehensive market intelligence that informs initial pricing strategy.
Why should imported inflatable pricing not dictate domestic market rates?
Compliance with 2024-2025 regulatory changes requires documented safety standards. UL-listed blowers and safety certifications meet insurance requirements that imported equipment often lacks. Domestic shipping from U.S. warehouses reduces delays, enabling faster delivery. Insurance requirement updates implemented in 2024-2025 raised minimum coverage standards that imported equipment may not satisfy, justifying premium pricing for compliant domestic inventory.
What differentiates JumpOrange's commercial-grade value from low-cost alternatives?
JumpOrange uses 15 oz vinyl versus competitors' 13 oz materials for superior durability. Heat-sealed seams outlast poor construction from budget suppliers. Complete business solutions exceed equipment-only sales approaches common with importers. JEM Club membership includes business training, marketing materials, and ongoing operational support. All-inclusive packages eliminate hidden costs and surprise add-ons that budget suppliers add after initial purchase.
How can business owners position themselves between budget and premium competitors?
Mid-range setups with standard materials cost $4,800, positioning between budget and premium tiers. Premium setups with full accessories cost $5,800, justifying top-tier pricing. Budget setups at $3,500 compete on price but sacrifice margin and quality positioning. Market saturation concerns—"There are already 3 bounce house companies in my town"—require differentiation through service quality, equipment condition, and business professionalism rather than competing solely on price.
What Common Pricing Mistakes Should New Rental Businesses Avoid?
Pricing errors destroy profitability and damage market positioning. Copying competitor rates without understanding costs creates unsustainable operations. Neglecting depreciation and maintenance accelerates equipment deterioration. Inconsistent pricing confuses customers and weakens brand trust.
Why does copying competitor pricing without cost awareness lead to losses?
Total annual fixed costs span $640-$4,200, averaging $2,420 that must be recovered. Total variable costs per event run $74-$122, averaging $98, including labor and transportation. Contribution margin of $252-$352 per event after variable costs determines minimum sustainable pricing. Fear that local markets won't support premium pricing causes operators to underprice below cost recovery thresholds, creating loss-making operations.
How does neglecting wear-and-tear depreciation affect long-term profitability?
Equipment becomes unusable within 18 months when cleaning and drying procedures are ignored. Seams split, and constant patches become necessary for continued operation. Operators spend more on repairs than they earn in profit without proper maintenance. Commercial-grade units last 5 years versus 18 months for poorly maintained equipment, requiring depreciation calculations that account for actual versus potential lifespan based on maintenance quality.
What happens when businesses fail to include travel, permits, or tax in quotes?
Safety certifications and documentation prevent liability issues that devastate uninsured operators. Proper documentation prevents customer concerns about weight limits and safety standards that cause booking cancellations. Hidden costs from competitors—shipping, setup accessories, warranties costing extra—create customer dissatisfaction when discovered after booking. Comprehensive quotes, including all costs, prevent disputes while ensuring cost recovery.
Why can inconsistent pricing confuse customers and weaken brand trust?
Professional appearance eliminates price negotiation—customers book immediately upon seeing quality setups. Satisfied customers book without negotiating when pricing remains consistent and transparent. Faded, cheap-looking equipment loses bookings to competitors with professional presentation. Professional image prevents loss of 3+ bookings per weekend that inconsistent pricing and appearance cause through customer confusion about the value proposition.
How Can Financing and Membership Programs Support Competitive Pricing?
Financing removes capital constraints that prevent premium equipment purchases. Membership programs provide ongoing support, enabling value-based pricing. Strategic use of financing aligns payment timing with seasonal cash flow patterns, improving financial sustainability.
What financing options reduce the initial capital burden for new owners?
BounceWave offers 90-day no-payment financing, enabling revenue generation before the first payment. Magic Jump partners with multiple lenders providing flexible approval options. Tent and Table offers payments as low as $118 monthly, fitting tight startup budgets. Ninety-day no-payment financing expanded significantly in 2024-2025, allowing operators to book 12-15 events and generate $4,000-$5,000 revenue before payments begin.
How does the JEM Club improve margins through discounts and free shipping?
Business training and marketing materials accelerate learning curves for new operators entering unfamiliar industries. Ongoing support helps rental operators navigate operational challenges that arise after initial launch. A community of 2,000+ successful rental entrepreneurs shares proven strategies and solutions. Free "Bounce House Business Starter Kit" download provides foundational knowledge, reducing costly mistakes that erode early profitability.
Why do membership programs allow owners to sustain value-based pricing instead of discounting?
Proven ROI calculators enable accurate financial planning and pricing decisions based on actual industry data. Customer success stories and case studies demonstrate achievable outcomes rather than theoretical projections. Business training covers operations, pricing strategies, and marketing tactics specific to inflatable rentals. Brands feel like partners invested in success rather than distant vendors, supporting confidence in premium pricing strategies.
How do financing timelines align with seasonal cash flow in the rental cycle?
Seasonal buyers order January-March for summer launches, allowing equipment delivery before peak season. Monthly payment options as low as $118 fit tight startup budgets without depleting working capital. Immediate opportunity buyers need fast delivery to capitalize on competitor gaps discovered during peak season. Expansion mode buyers order 2-4 times yearly, timing purchases after successful seasons generates reinvestment capital.
How Should Entrepreneurs Track and Adjust Pricing Over Time? (Bridge to Optimization)
Continuous monitoring reveals pricing accuracy and adjustment opportunities. Performance indicators guide rate increases that markets will accept. Inflation, maintenance costs, and market growth justify annual repricing. Structured data collection enables evidence-based pricing optimization.
What performance indicators (rental volume, ROI, downtime) reveal pricing accuracy?
Conservative Scenario (48 events yearly at $275): Year 1 nets $6,436 profit. Three-year cumulative reaches $23,308 for 583% ROI.
Moderate Scenario (72 events yearly at $350): Year 1 nets $15,724 profit. Three-year cumulative hits $51,172 for 1,279% ROI.
Optimistic Scenario (96 events yearly at $450): Year 1 nets $31,372 profit. Three-year cumulative reaches $98,116 for 2,453% ROI.
Booking velocity exceeding 2 events weekly signals pricing below market capacity. Utilization below 1 event weekly indicates overpricing or insufficient marketing.
How can customer feedback and repeat bookings signal readiness for rate increases?
Parents specifically requesting businesses by name indicate strong brand equity supporting premium pricing. Community recognition—"You're the bounce house lady!"—creates local market dominance, justifying rate increases. Event photos showcasing professional equipment attract prospective customers willing to pay premium rates. Competitor Instagram analysis reveals market rate evolution requiring periodic adjustments to maintain competitive positioning.
Why should inflation, maintenance cost, and warranty renewal guide annual repricing?
Material innovations in 2023-2025 improve durability, justifying premium positioning for newer equipment. Insurance requirement updates implemented in 2024-2025 increased compliance costs, requiring rate adjustments. Post-pandemic demand surge of 35% booking increases supports market rate growth. Market growth at 7.2% CAGR creates expansion opportunities while supporting 5-7% annual rate increases, matching economic conditions.
How does structured data logging (invoicing tools, CRM reports) refine pricing forecasts?
Create detailed comparison charts tracking specifications, prices, and actual booking rates. Calculate ROI scenarios: "If I book this 2x per month at $125..." comparing projected versus actual performance. Detail-oriented analysis reads every booking pattern, seasonal variation, and competitive response. Personal consultation with industry experts refines strategies based on accumulated operational data rather than theoretical projections.
How Can JumpOrange Help You Establish and Maintain Profitable Pricing?
Expert guidance prevents costly pricing mistakes during business launch. Consultation services provide market-specific rate recommendations based on regional demand. Warranty coverage and safety certifications justify premium positioning. Ongoing support ensures pricing evolves with market conditions and business growth.
How does JumpOrange's expert consultation guide new owners in setting sustainable rates?
Personal consultation from business owners provides industry-specific insights unavailable from sales representatives. Equipment selection guidance matches inventory to local market demand patterns and pricing potential. Proven ROI calculators enable accurate pricing based on actual cost structures and revenue projections. Market demand analysis identifies optimal pricing tiers for specific geographic and demographic markets.
What warranty and safety certifications justify premium pricing confidence?
Commercial-grade excellence with 15 oz vinyl exceeds industry standards set by budget competitors. UL-listed safety certifications meet insurance and regulatory requirements, protecting business assets. Five-year warranties provide peace of mind throughout primary revenue-generating periods. All-inclusive packages eliminate hidden costs, enabling accurate pricing without unexpected expenses, reducing margins.
How do U.S. warehouse operations in California and Florida reduce logistics costs?
Fast domestic shipping affects business launch schedules positively compared to international imports, requiring months of lead time. Primary market focus on suburban and growing metropolitan areas optimizes distribution efficiency. Sun Belt state positioning—Texas, Florida, Arizona, Georgia, North Carolina—reduces shipping times to the highest-demand markets. Expansion mode buyers ordering 2-4 times yearly benefit from consistent inventory availability, enabling rapid fleet growth.
Why do long-term JumpOrange clients report higher ROI and repeat business metrics?
Brand promise—"We help you build a profitable rental business your family and community can be proud of"—aligns manufacturer success with customer outcomes. Phone support with staff who actually answer calls solves problems quickly, minimizing downtime that damages revenue. Personal phone support from industry experts provides ongoing pricing guidance as markets evolve. Ongoing relationships extend beyond initial purchases into long-term business development partnerships supporting sustained profitability through strategic pricing optimization. Contact JumpOrange today!
Leave a comment
This site is protected by hCaptcha and the hCaptcha Privacy Policy and Terms of Service apply.