Key Takeaways:
- Corporate events command $750 average rates with 55% year-over-year growth in 2024, delivering 300% team engagement increase and 92% positive recall after six months.
- Schools book 20-30 events annually with 80-90% repeat rates at $550 per field day serving 50-150 participants (2-4x more than corporate events).
- Peak season revenue fluctuates 40% between May-August, with summer reaching 83% utilization (10 events/month at $400) versus winter 25% utilization (3 events/month at $300).
- First-year ROI averages 393% with 6-8 month breakeven, generating $25,200 annual revenue at moderate utilization (72 events/year, 1.5 rentals/week).
- Insurance requirements vary by segment: $2M-$5M liability for corporate adults, $1M-$2M for schools, with supervision ratios of 1:8 for children and 1:15 for adults.
Institutional markets drive predictable revenue streams with high-volume bookings. Schools and corporations represent distinct demographics requiring specialized operational approaches. Understanding demand signals, compliance requirements, and pricing strategies positions operators for sustainable growth in commercial markets. This analysis quantifies institutional demand and provides actionable deployment frameworks.
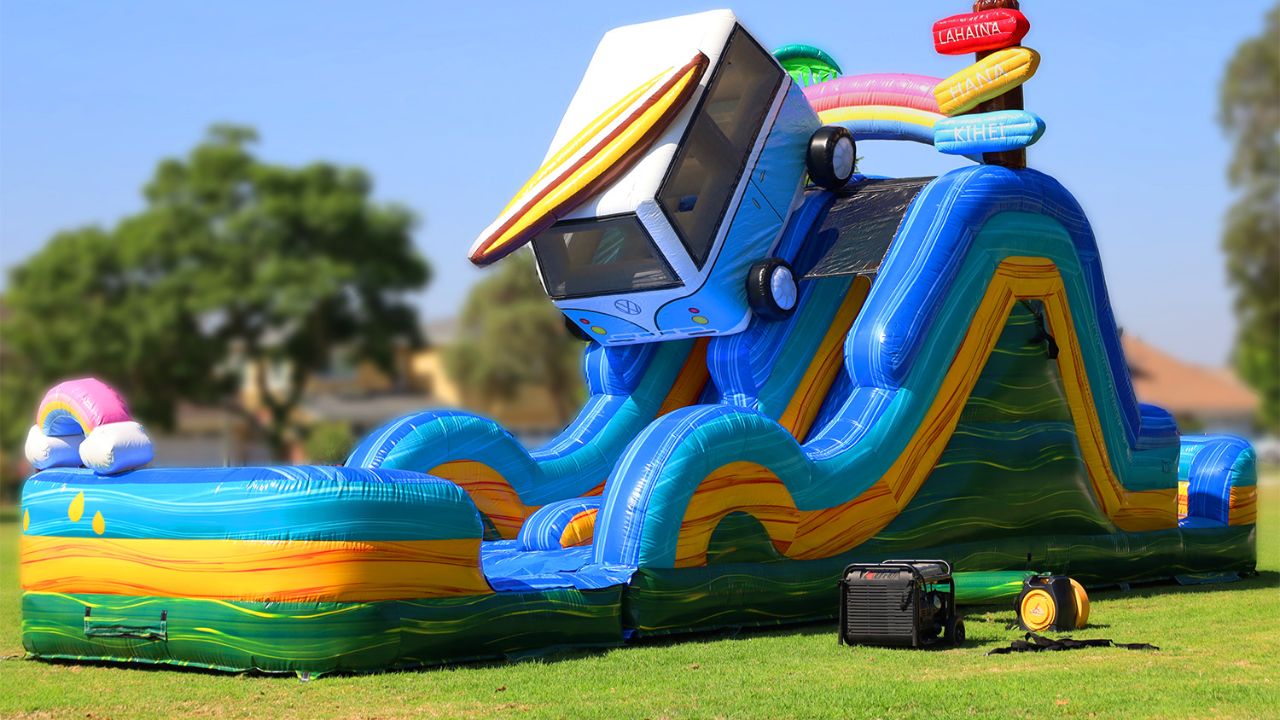
What is a 40 ft inflatable obstacle course, and why do institutions rent them?
Physical specifications and regulatory compliance determine institutional suitability. Equipment design directly affects throughput and safety performance. Understanding commercial-grade features explains institutional purchasing decisions.
How do size, dual-lane design, and throughput make them suitable for large group play?
Multiple challenge elements, including climbing walls, tunnels, and slides, accommodate varied skill levels. Obstacle courses require 20-25 sq ft operational space supporting large group deployments. Multi-lane competitive racing formats accommodate higher participant volumes efficiently. Dual-lane inflatables improve throughput at high-traffic events serving 50-150 participants. Configuration flexibility enables age-appropriate lane assignments, separating elementary from teen users.
Which JumpOrange commercial models qualify as event-grade units under ASTM and CPSC standards?
Commercial-grade units built with 15 oz reinforced vinyl versus competitors' 13 oz materials. Features heat-sealed seams preventing splitting under pressure from repeated institutional use. UL-listed blowers and safety certifications meet institutional procurement requirements. Approximately 80% of US cities require adherence to ASTM F2374 standards for commercial inflatables. ASTM F2374 standards cover design, manufacture, installation, operation, maintenance, and inspection protocols.
Why do safety certifications, anchoring systems, and high-capacity layouts appeal to risk-managed venues?
Anchoring requirements mandate a minimum of 4-8 anchor points, depending on unit size. Commercial units typically support 2,000-3,000 lbs total weight load, accommodating adult participants. Enhanced safety features, including reinforced anchor points, meet institutional risk management standards. Material innovations in 2023-2025 improve durability and safety compliance, reducing liability exposure. Quick-deflation technology enables faster turnarounds between same-day events.
How strong is current market demand from schools and corporate organizations?
Market indicators confirm accelerating institutional adoption rates. Budget allocation data reveals sustained investment priorities. Understanding growth trajectories guides inventory decisions.
What rental-request and purchase-order data show institutional growth since 2022?
Post-pandemic recovery fueled 35% increase in rental bookings across all segments. Corporate events showed 55% year-over-year growth in 2024 outpacing residential markets. Global bounce house market projected to reach $6.2 billion by 2034 supporting continued expansion. Event marketers reported 73% received budget increases in 2023 enabling larger purchases. Event costs projected to increase by 4.3% year-over-year in 2025 favoring durable equipment.
How do seasonal peaks—spring field days and summer team events—shape inventory planning?
Peak rental season runs from May to August with up to 40% revenue fluctuation. School peak season concentrates April-June over 3 months requiring focused capacity. Corporate peak season extends April-October over 8 months providing seasonal balance. Spring (March-May) delivers 6 events monthly at 50% utilization with $350 average rate generating $2,100 monthly revenue. Summer (June-August) peaks at 10 events monthly at 83% utilization with $400 average rate producing $4,000 monthly revenue.
What social-media and Google-Trends signals confirm continued interest in obstacle course rentals?
Themed inflatable designs generate 40% more bookings than standard models demonstrating design preferences. Interactive elements command 23% premium in rental rates validating feature investments. Word-of-mouth marketing: "You're the bounce house lady! My daughter still talks about her party!" Community recognition creates local celebrity status among families driving organic referrals. Ninety-two percent of participants recall corporate events positively after six months sustaining repeat bookings.
Which school event formats consistently book 40 ft courses?
Educational institutions provide high-volume bookings with exceptional loyalty rates. Understanding event types optimizes marketing and operational planning. School relationships build predictable revenue foundations.
What K-12 activities (field days, PBIS rewards, fundraisers) sustain repeat demand?
School field days average $550 rental revenue per event with $400-$650 day rate range. Booking frequency reaches 20-30 events per operator annually concentrating in spring months. Schools provide 80-90% repeat booking rates annually—exceptional customer loyalty. Event types include field days, fundraisers, after-school programs, school carnivals, physical education, reward days. Schools typically rent 2-4 times annually with field days representing primary booking opportunity.
How do middle- and high-school groups leverage competition formats for engagement?
Children aged 5-12 account for 65% of all participants representing core demographic. Teens ages 13-17 comprise 10% of participants preferring competitive formats. Competitive lanes recommended for older children ages 8-12 matching developmental capabilities. Multi-lane competitive racing formats improve engagement and participant satisfaction. School events maintain 5-10% cancellation rates versus 15-20% for corporate bookings demonstrating commitment.
What facility factors—gym ceilings, turf space, power access—drive suitability on campus?
Setup complexity runs low-medium for school grounds with accessible infrastructure. Schools serve 50-150 participants per event—2-4x more than corporate events. Average group sizes reach 50-150 participants for high-volume school deployments. Decision-making timeline of 2-6 months advance booking enables better inventory planning. Typical event duration spans full day at 6-8 hours maximizing utilization.
Which corporate programs and venues use these courses most effectively?
Corporate market delivers premium pricing with moderate booking volumes. Understanding HR budget cycles and event formats optimizes targeting. Adult participation requires modified safety and insurance protocols.
What event categories—team-building days, family picnics, wellness fairs—favor obstacle setups?
Corporate events average $750 rental revenue per event with $500-$1,000 day rate range. Event types include team-building retreats, company picnics, wellness initiatives, client entertainment, new employee onboarding. Corporate teams using obstacle courses report 300% increase in team engagement metrics. Organizations utilizing obstacle courses report high retention and engagement driving repeat bookings. Typical event duration spans half day at 4-6 hours fitting corporate schedules.
How do HR and ESG departments justify rentals as wellness or morale investments?
Companies typically allocate $100-$500 per employee annually for team-building activities. Budget allocation per employee runs $100-$500 annually for corporate team-building programs. Corporate budgets run 10-20x higher per participant than school budgets enabling premium pricing. Corporate wellness programs increasingly incorporate physical team-building activities driving demand. Inflatable obstacle courses positioned as cost-effective solutions for engaging large groups.
Which layout options (relay races, dual timing lanes) fit adult participants safely?
Adults ages 18+ represent 25% of participants in obstacle course rentals. Adults ages 18+ accommodate recommended max capacity of 15-25 participants. Individual weight limits reach up to 250 lbs maximum per participant. Recommended course features include corporate challenges, endurance courses, team competitions. Average group size spans 20-40 participants for corporate events.
How do performance and capacity compare with other attractions?
Operational efficiency determines profitability beyond pricing strategies. Understanding throughput metrics guides staffing and scheduling decisions. Comparative analysis reveals competitive positioning advantages.
What riders-per-hour benchmarks do dual-lane courses achieve under two attendants?
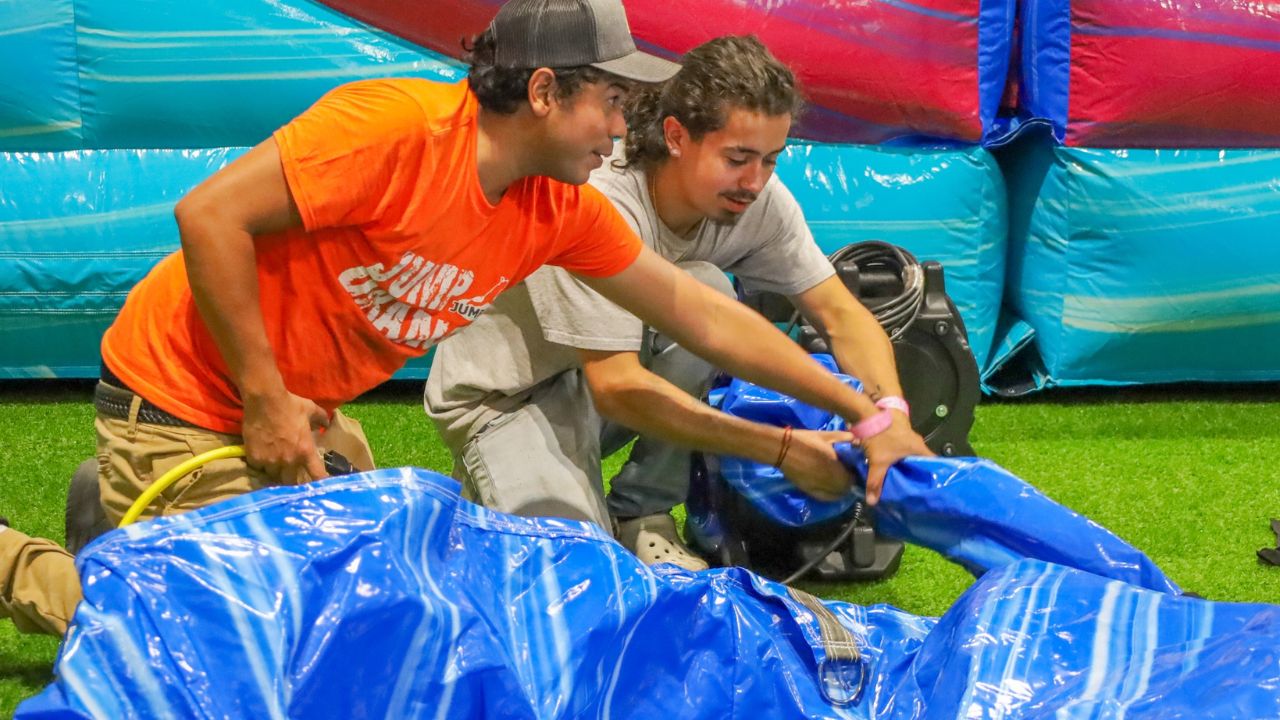
Setup time runs 20-25 minutes depending on configuration complexity. Breakdown time requires 15-20 minutes for standard operations. Setup requires 3-person crew for 3 hours total costing $54-$72 per event in labor. Capacity management strictly enforces maximum capacity limits of 1 participant per 15-20 sq ft. Continuous supervision required at all times for children ensuring safety compliance.
When does a 40 ft course outperform smaller units in cost-per-participant efficiency?
Revenue per dollar invested reaches $7.20 for 40ft obstacle courses. Forty-foot obstacle courses represent sweet spot balancing ROI with manageable market saturation. Annual revenue potential hits $25,200 at moderate utilization rates. Profit margins reach 68% for corporate events and 60% for school events. Inflatable obstacle courses demonstrate 10:1 ROI potential for party rental operators.
How do queue systems and MC coordination sustain flow during large turnouts?
Entry and exit control with designated points and controlled flow prevents bottlenecks. Modular sections with adjustable difficulty levels accommodate mixed skill groups. Average utilization reaches 1.5 rentals per week across institutional markets. Moderate utilization delivers 72 events yearly with mixed institutional composition. Attendant service costs $25-$50 hourly with 40-60% profit margins.
What compliance and liability standards govern school and corporate deployments?
Regulatory requirements vary by venue type and participant demographics. Understanding insurance and certification standards prevents costly violations. Documentation protocols protect operators and institutional clients.
Which documents (COI, additional insured, safety inspection reports) are non-negotiable?
Insurance requirements mandate $2M-$5M liability for corporate events and $1M-$2M for schools. Commercial liability insurance of $5M+ required for adult participants. General liability insurance costs $300-$1,500 annually averaging $900. Small inflatable rental businesses average $1,057 yearly for basic coverage. Documentation maintains logs for liability protection if incidents occur.
How do supervision ratios and operator certifications vary by age group?
Young children ages 4-7 require 1 adult per 5 children supervision ratio. Older children ages 8-12 require 1 adult per 8 children supervision ratio. Teens ages 13-17 require 1 adult per 10 teens supervision ratio. Adults ages 18+ operate self-supervised or with 1 staff per 15 adults. Many jurisdictions require certified inflatable operators with training in safety protocols.
Why do fire-retardant vinyl and sealed seams reduce risk exposure for event organizers?
Commercial-grade PVC materials provide durability across age groups reducing failure rates. Fifteen-ounce vinyl versus competitors' 13 oz materials ensures structural integrity. Heat-sealed seams versus poor durability from budget suppliers prevent mid-event failures. Ninety-five percent of bounce house injuries preventable with proper supervision. Most common injuries include sprains, fractures, contusions from collisions or falls.
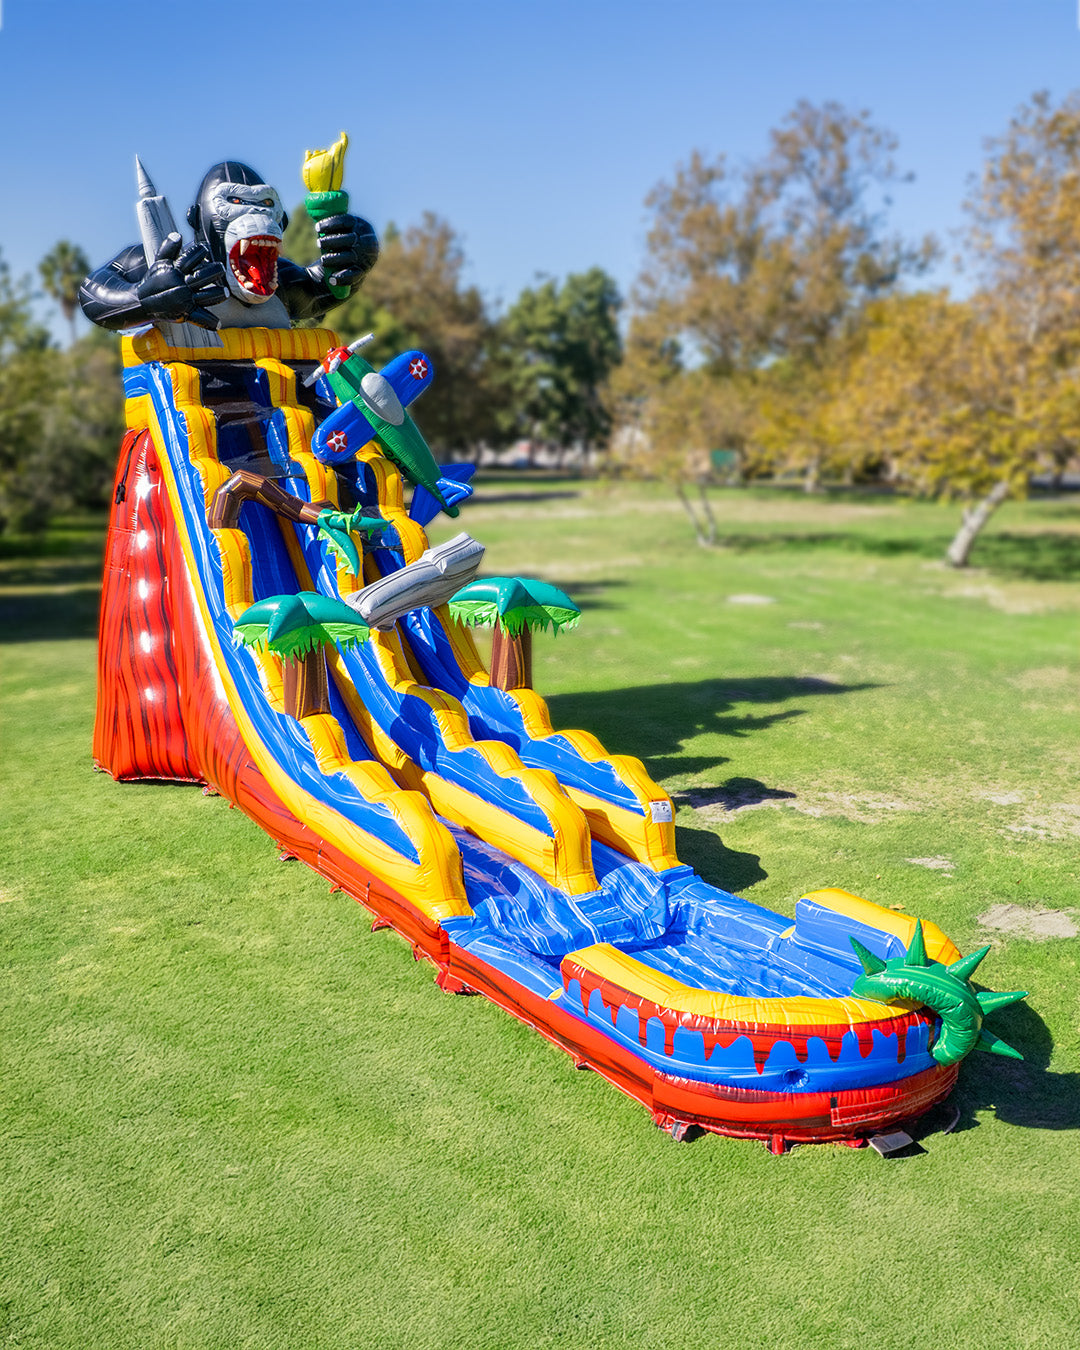
How does wet vs. dry configuration affect institutional appeal and risk management?
Configuration modes significantly affect insurance requirements and operational complexity. Seasonal factors determine optimal mode selection. Understanding weather-dependent modifications optimizes utilization.
Which seasons and climates favor wet mode for outdoor events?
Configuration mix for heavy-duty commercial grade water slides varies seasonally: Spring 60% dry/40% wet, Summer 30% dry/70% wet, Fall 70% dry/30% wet, Winter 95% dry/5% wet. Sun Belt states—Texas, Florida, Arizona, Georgia, North Carolina—support year-round outdoor events. Year-round availability with premium positioning versus 6-month seasonal for wet-only equipment. Dual-use wet/dry configuration adds $200 in additional equipment costs. Wet configurations require water source access and drainage considerations affecting site selection.
How do dry setups simplify insurance and reduce cleanup downtime?
Winter months (December-February) run 95% dry and 5% wet for indoor event applications. Fall (September-November) delivers 5 events monthly at 42% utilization with $325 average rate yielding $1,625 monthly revenue. Winter (December-February) produces 3 events monthly at 25% utilization with $300 average rate generating $900 monthly revenue. Breakdown time reaches 15-20 minutes for dry configurations versus longer wet teardown. Setup time runs 20 minutes for dry versus 25 minutes for wet operations.
What additional safety checks (drains, anti-slip mats, towels) are required onsite?
Pre-event inspection checklist includes visual inspection for tears, holes, or wear. Seam integrity checks required before event deployment. Blower function and air pressure tests mandatory before participant access. Cleanliness and sanitation verification protects brand reputation. Weather restrictions limit operation to 15-20 mph wind speed maximum.
How do logistics and site layouts influence feasibility for different venues?
Venue selection significantly affects operational efficiency and profitability. Surface types determine anchoring methods and equipment suitability. Understanding venue requirements prevents costly setup failures.
What power draw, blower count, and distance limits affect corporate campuses vs. school fields?
UL-listed blowers and safety certifications meet institutional electrical standards. Blower function and power routing verification required before operations commence. Temperature considerations limit operations: PVC material integrity compromised below 40°F. Floor protection requirements safeguard indoor venue surfaces from equipment damage. Doorway access dimensions determine transport and setup feasibility for indoor venues.
Which surfaces (grass, pavement, indoor floors) require unique anchoring and ballast plans?
Stakes driven 18-24 inches into ground secure grass installations for all weight classes. Weighted sandbags with minimum 40 lbs each required for hard surface applications. Anchor point verification required in pre-event inspection checklists. Setup complexity varies between grass fields and paved surfaces affecting labor costs. No operation permitted during rain, lightning, or severe weather conditions.
How should operators schedule delivery windows and setup teams for back-to-back bookings?
Setup time runs 20-25 minutes depending on configuration complexity. Breakdown time requires 15-20 minutes for standard operations. Transportation and fuel cost $20-$50 per event averaging $35. Delivery and setup fees of $50-$150 carry 60-80% profit margins. Total variable costs per event run $74-$122 averaging $98.
What pricing and package strategies align with institutional budgets?
Strategic pricing captures maximum value while maintaining competitive positioning. Understanding institutional budget cycles optimizes revenue capture. Package offerings turn operational requirements into profit centers.
When should you offer flat-day rates versus hourly attendant-included quotes?
Conservative pricing starts at $275 per event for budget-conscious markets. Moderate market-based pricing averages $350 per event as industry standard. Premium value-based pricing reaches $450 per event in affluent areas. Corporate events command 25-50% premium pricing over school events reflecting higher budgets. Weekend rates run $350-$450 for peak demand periods.
How do multi-unit bundles (course + slide + generator) improve margins per event?
Package deals offering 10-20% discounts maintain 25-35% profit margins while increasing transaction value. Multiple units or add-ons increase per-event value beyond single-item rentals. Essential accessories including stakes, tarps, sandbags, transport carts cost $300-$800. Extended rentals add $50-$100 per hour with 90%+ profit margins. Damage waivers of $25-$50 provide 95%+ profit margins offering customer peace of mind.
Which discount tiers (PTA, non-profit, corporate bulk) sustain year-round demand?
Budget allocation per student runs $10-$30 annually in school sector. Customer acquisition cost remains low at $50-$100 per client for schools. Customer acquisition cost runs high at $150-$300 per client for corporate requiring different approaches. Weekday discounts of 20-30% fill mid-week availability during slow periods. Dynamic pricing spans $250-$500 depending on demand fluctuations and booking windows.
What value-added features boost engagement and justify premium pricing?
Add-on services increase average transaction value and competitive differentiation. Understanding feature preferences optimizes investment decisions. Enhancement options address institutional engagement goals directly.
How do digital timers and leaderboards increase team competition?
Themed customization costs $50-$200 with 70-85% profit margins enhancing differentiation. Interactive elements command 23% premium in rental rates validating feature investments. Dual-lane timing systems justified for teens and adults seeking competitive experiences. Competitive racing, advanced obstacles, team challenges appeal to teen demographics. Equipment creating "wow" reactions establishes competitive advantages attracting premium clients.
When do photo backdrops and branding arches generate sponsor ROI?
Digital marketing integration commands 23% premium in rental rates. Sponsorship signage improves donor visibility at fundraising events. Event photos showcase professional equipment to prospective donors building credibility. Corporate clients represent higher lifetime value at $7,500-$25,000 annually per client. Visual impact creates "wow" reactions establishing competitive advantages in crowded markets.
What add-ons (trophies, music packages, MC scripts) extend average booking value?
Attendant service costs $25-$50 hourly with 40-60% profit margins for operators. Extended rentals add $50-$100 hourly with 90%+ profit margins beyond base rates. Package deals offer 10-20% discounts while maintaining 25-35% profit margins. Setup labor appears as transparent line items preventing disputes. Delivery zones based on distance affect quotes enabling dynamic pricing.
How can data confirm that demand is sustainable and profitable?
Performance metrics guide inventory and operational decisions. Institutional-specific tracking reveals profitability patterns. Understanding utilization by segment optimizes resource allocation.
Which metrics (booking frequency, utilization hours, repeat client ratio) signal growth?
Booking frequency reaches 15-25 events per operator annually for corporate segment. Booking frequency reaches 20-30 events per operator annually for schools segment. Average utilization reaches 1.5 rentals per week across institutional markets. Moderate utilization delivers 72 events yearly with mixed institutional composition. Repeat booking rates reach 60-70% annually for corporate and 80-90% for schools.
What ROI benchmarks define payback for a single 40 ft unit in institutional markets?
First-year ROI averages 393% under moderate booking scenarios. Breakeven occurs within 6-8 months under moderate to premium scenarios. Average ROI timeline runs 4-8 months with potential 10:1 ROI compared to standard bounce houses. Annual revenue potential hits $25,200 at moderate utilization rates. Revenue per dollar invested reaches $7.20 for 40ft obstacle courses.
How do incident logs and survey ratings correlate with renewal probability?
Over 10,000 emergency room visits annually related to bounce houses in the US. Four hundred seventy-nine serious injuries reported over 21-year period from 2000-2021. Ninety-five percent of injuries preventable with proper safety measures and trained staff. Schools demonstrate greater commitment with 5-10% cancellation rates versus 15-20% for corporate. Ninety-two percent of participants recall corporate events positively after six months.
What marketing channels reach event decision-makers most effectively?
Institutional sales require targeted outreach to specific decision-makers. Understanding approval hierarchies optimizes sales cycles. B2B marketing strategies differ fundamentally from consumer approaches.
Who approves rental spend in schools (PTA, activities directors, district buyers)?
School events involve multiple stakeholders including administrators, PTA/PTO leadership, facilities managers. Decision-making timeline runs 2-6 months advance booking for schools requiring early outreach. Extended decision-making timeline requires early outreach but enables better inventory planning. Customer acquisition cost remains low at $50-$100 per client for schools. School relationships easier to establish than corporate requiring different marketing approaches.
Which corporate contacts (HR, event planners, facility coordinators) control final bookings?
Decision-making timeline runs 2-4 weeks advance booking for corporate events. Payment terms offer Net 30 days invoice providing extended payment flexibility. Customer acquisition cost runs high at $150-$300 per client for corporate. HR and event managers control bookings requiring specialized marketing approaches. Professional setup expectations for corporate events demand higher service standards.
How do email campaigns, demo days, and LinkedIn content support B2B conversion?
Primary customer age range spans 28-42 years old during peak entrepreneurial energy phases. Sixty-seven percent currently employed full-time in teaching, nursing, sales, office management roles. Customer success stories and case studies build credibility with prospective institutional clients. Community of 2,000+ successful rental entrepreneurs shares strategies validating business model. Equipment selection guidance matches inventory to local market demand patterns.
What common objections arise and how should operators respond?
Institutional buyers require evidence-based responses to risk concerns. Understanding objection patterns enables proactive messaging. Documentation and policies address liability anxieties directly.
How to address concerns about safety, weather, and liability up front?
Ninety-five percent of injuries preventable with proper safety measures and trained staff. Commercial-grade safety certifications protect business from liability issues meeting institutional standards. Safety certifications and documentation prevent liability issues keeping operators compliant. Proper documentation prevents customer concerns about weight limits and safety specifications. Pre-event site inspection checklists prevent venue incompatibility issues causing delays.
Which policies (rain dates, indoor backup sites) protect institutional clients?
Weather restrictions limit operation to 15-20 mph wind speed maximum for safety. No operation permitted during rain, lightning, or severe weather conditions. Temperature considerations: PVC material integrity compromised below 40°F limiting winter operations. Cancellation rates run 5-10% for schools and 15-20% for corporate reflecting commitment differences. Indoor event applications maintain baseline revenue during slow months offsetting weather cancellations.
How to defend pricing with capacity metrics and risk-reduction value?
Corporate event profitability reaches $7,650-$12,750 annual profit potential per operator. School field day profitability reaches $6,600-$9,900 annual profit potential per operator. Profit margins run 30-40%—significantly higher than general party rentals at 15-25%. Contract value (annual) reaches $7,500-$25,000 per client for corporate and $800-$1,950 for schools. Professional appearance eliminates price negotiation—customers book immediately upon seeing quality setups.
How should you bridge macro insights into operational execution? (Bridge)
Strategic frameworks require tactical implementation steps. Pilot programs validate market assumptions before scaling. Systematic documentation enables continuous improvement and marketing effectiveness.
Step 1 – Pre-sale: How to pilot a demo event with one school and one company?
Schools plan 2-6 months in advance enabling better scheduling and relationship building. Corporate decision timeline runs 2-4 weeks advance booking requiring faster response. Larger school districts may coordinate multiple events across different campuses creating bulk booking opportunities. Successful rental operators often establish school relationships first to build consistent base revenue. Then expand into corporate markets to capture premium pricing and extended seasonal demand.
Step 2 – Content: How to document video proof of engagement for marketing?
Event photos showcase professional equipment to prospective donors and future clients. Customer success stories and case studies build credibility with institutional buyers. Ninety-two percent of participants recall corporate events positively after six months validating impact. Word-of-mouth marketing creates organic referral networks reducing acquisition costs. Visual impact creates "wow" reactions establishing competitive advantages in crowded markets.
Step 3 – Refinement: How to use data to tune pricing, setup time, and staffing?
Creates detailed comparison charts of specifications, prices, warranties informing decisions. Calculates ROI scenarios for financial planning and pricing optimization. Proven ROI calculators enable accurate pricing decisions based on actual performance. Total variable costs per event run $74-$122 averaging $98 for budgeting. Setup time runs 20-25 minutes and breakdown time requires 15-20 minutes for scheduling.
Step 4 – Scaling: How to add a second unit once corporate and school demand split the calendar?
Corporate events extend across eight months (April-October) reducing seasonal concentration risk. Schools concentrate in three-month peak (April-June) creating capacity constraints. Balanced portfolio of both client types optimizes year-round utilization reducing idle time. Operators serving both markets benefit from diversified revenue streams stabilizing cash flow. Extended seasonal operations optimize equipment utilization improving overall ROI.
Are 40 ft obstacle courses a strategic investment for institutional rental operators?
Financial metrics confirm viability for focused operators. Repeat institutional contracts provide predictable revenue streams. Manufacturer support determines long-term profitability and operational efficiency.
What minimum utilization and revenue thresholds justify owning multiple units?
Annual revenue potential reaches $25,200 at moderate utilization rates per unit. First-year ROI averages 393% under the moderate scenario with institutional focus. Revenue per dollar invested reaches $7.20 for 40ft obstacle courses. Average utilization reaches 1.5 rentals per week across institutional markets. Moderate utilization delivers 72 events yearly with mixed institutional composition.
How do repeat contracts with districts and corporations stabilize annual cash flow?
Schools provide 80-90% repeat booking rates annually—exceptional customer loyalty. Corporate repeat rates reach 60-70% annually, demonstrating strong retention. Schools demonstrate greater commitment with 5-10% cancellation rates, protecting revenue. Contract value (annual) reaches $7,500-$25,000 per client for corporate relationships. School relationships deliver higher loyalty, making them ideal anchor clients for stable base revenue.
Why does JumpOrange's commercial-grade build and U.S. support network reinforce long-term ROI?
Commercial-grade water slide and bounce house combos last 5 years under regular rental use versus 18 months for residential alternatives. Five-year warranty provides peace of mind throughout primary revenue-generating periods. Fast domestic shipping from California and Florida warehouses affects turnaround times positively. Complete packages eliminate hidden costs that erode profitability over equipment lifespan. Brand promise: "We help you build a profitable rental business your family and community can be proud of." JEM Club membership includes business training, marketing materials, and ongoing support. Phone support is available with staff who actually answer calls, solving problems quickly. Personal phone support from industry experts who understand rental operations. Contact JumpOrange today!RetryClaude can make mistakes. Please double-check responses.
Leave a comment
This site is protected by hCaptcha and the hCaptcha Privacy Policy and Terms of Service apply.