The birthday party rental market for children ages 4-12 is experiencing a significant transformation in 2026. Parents now spend an average of $314 per celebration, prioritizing themed experiences over traditional gatherings. The shift reflects broader birthday party trends 2026, where elaborate entertainment replaces simple backyard setups. Millennial parents drive this change, allocating larger budgets to create memorable milestone moments documented across social media.
Experience-based parties continue gaining momentum, growing at 18% year-over-year compared to traditional celebrations. Children directly influence 90% of household purchase decisions, including party planning and rental selections. This influence shapes which kids' inflatable rental operators stock and how businesses position premium offerings.
Key Takeaways
- Experience-based parties are growing at 18% annually compared to 3% for traditional celebrations
- 81% of parents desire specific themes with Superheroes, Princesses, and Dinosaurs leading in 2026
- Safety ranks highest (92/100) in parent priorities, followed by entertainment value and equipment quality
- Millennial parents spend 23% more on celebrations than Generation X and 45% more than Baby Boomers
-
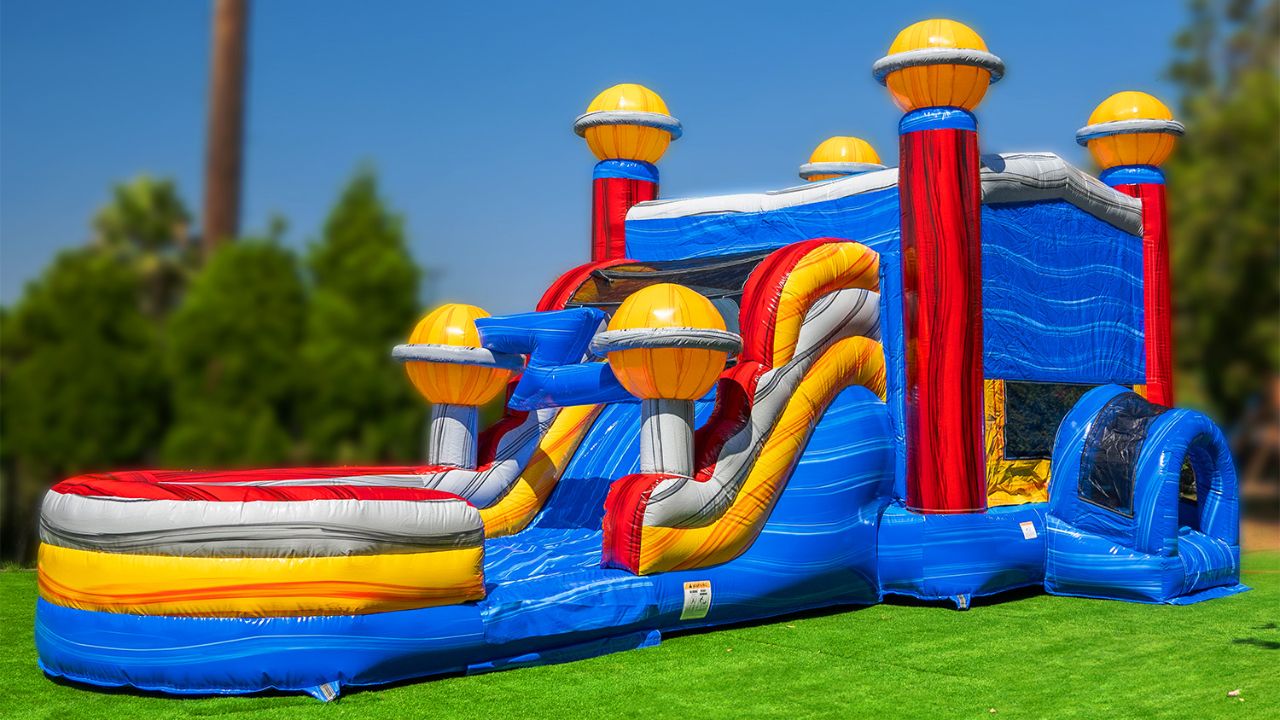
Standard bounce houses (13x13 or 15x15) and large water slides (18-20+ feet) remain top rental choices
What Defines the Current Birthday Party Rental Market for Kids 4-12?
The children's birthday party segment represents 36.88% of the total rental market end-use. American families collectively spend $15.8 billion annually on birthday celebrations for this age group. This market expansion is fueled by parents' preferences shifting toward professional-grade entertainment rather than DIY solutions.
The bounce house rental segment alone is valued at $4.46 billion in 2025. Industry projections indicate growth to $6.43 billion by 2034 across all inflatable categories. Combo units featuring both bounce areas and slides show particularly strong performance at 6.48% CAGR.
Which Rental Products Are Popular Among This Age Group?
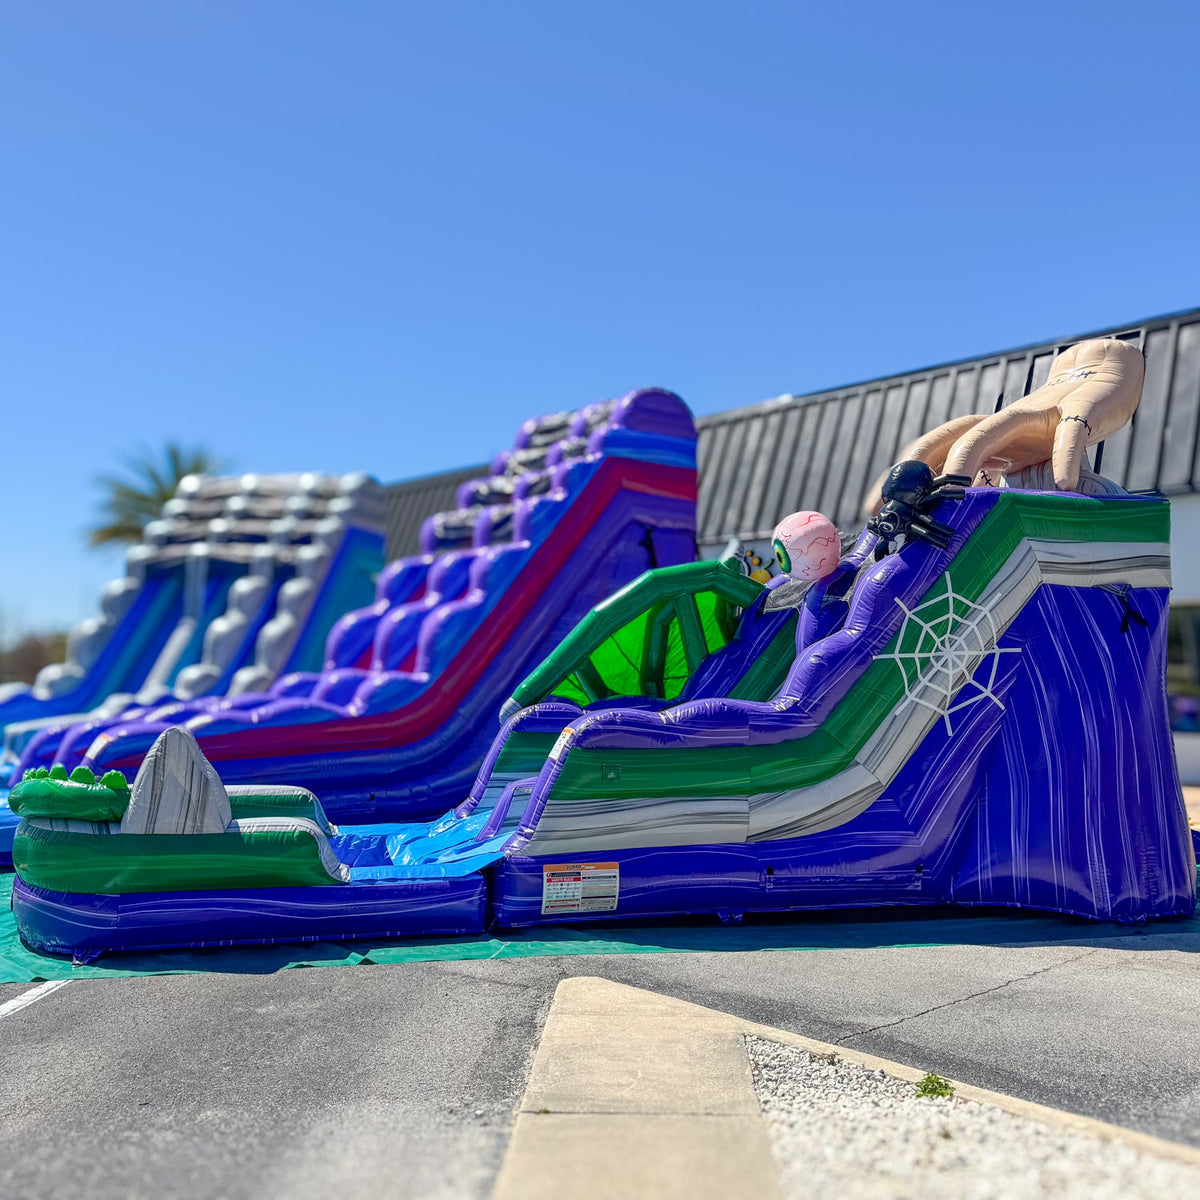
Standard bounce house sizes of 13x13 or 15x15 feet dominate bookings for younger children. Large water slides measuring 18-20+ feet attract families with children in the upper age range. Bounce house combo rentals by age group provide versatile entertainment solutions that accommodate mixed-age guest lists.
The Bounce House with Slide sub-segment is expanding at 6.48% annually through 2034. Popular party themes 2026 include Superheroes, Princesses, and Dinosaurs, driving demand for character-specific inflatables. Theme-based units command premium pricing compared to generic designs due to enhanced visual appeal.
How Do Themes and Aesthetic Preferences Shape Booking Choices?
Approximately 81% of parents desire specific themes when planning children's birthday celebrations. Pinterest serves as the primary inspiration source for party planning among modern families. Parents prioritize visually cohesive setups that photograph well for social media documentation.
Aesthetic considerations now influence rental selections as much as entertainment value. Pastel-colored inflatables and licensed character designs generate higher booking rates than standard primary colors. This trend reflects broader consumer behavior where Instagram-worthy experiences justify increased spending.
Who Are the Primary Consumers Driving Market Demand?
Millennial parents spend 23% more on parties than Generation X and 45% more than Baby Boomers. This generation views celebrations as essential experiences rather than optional expenditures. Backyard bounce house rentals and safety guidelines address this demographic's heightened focus on child safety during celebrations.
Children directly influence 90% of household purchase decisions, according to recent consumer behavior studies. The individuals' end-use segment totals 36.88% of the overall party rental market share. This data confirms that targeting parent-child decision-making units is essential for rental business success.
Why Are Experience-Based Rentals Gaining Traction in 2026?
Experience-based parties are growing at 18% year-over-year compared to 3% for traditional at-home celebrations. Parents increasingly prioritize creating memorable moments over simple cake-and-gifts gatherings. This shift is driven by social media influence and changing generational values around childhood experiences.
Approximately 60% of children prefer elaborate or very elaborate birthday celebrations over modest parties. This preference peaks among children ages 6-7, where 65% desire elaborate party experiences. The trend toward experiential celebrations supports premium pricing strategies for entertainment-focused rental inventory.
What Interactive and Entertainment Options Are Most Booked?
Children rank gifts first (41%), followed by family time (39%), birthday cake (38%), and games/entertainment (34%). However, interactive rental equipment now appears in most celebration budgets regardless of priority ranking. Water slides, obstacle courses, and combo units deliver sustained entertainment throughout multi-hour celebrations.
Why slip and slides are a hit for birthday parties explains the appeal of water-based entertainment during warmer months. Interactive stations complement primary inflatables, increasing overall booking values. Families frequently bundle multiple entertainment categories to maintain engagement for diverse age ranges.
How Do Social Media and Parental Priorities Influence Trends?
Approximately 60% of children prefer elaborate or very elaborate birthday celebrations in 2026. Children ages 6-7 show the highest preference, with 65% desiring elaborate party experiences. This data demonstrates how peer comparison and social visibility influence family spending.
Social media platforms drive parent preferences toward visually distinctive entertainment options that photograph well. Pinterest remains the number one inspiration source for party planning among target demographics. Rental operators who emphasize aesthetic appeal alongside entertainment value capture a larger market share.
What Pricing Strategies Align With Premium Rental Selections?
The average cost for a child's party reached $314 in 2026 across all categories. Children's birthday rentals range from $87 to $312 for budget to mid-range equipment. How to price your combo bounce house with slide rentals for optimal profitability provides frameworks for positioning premium inventory.
A 50% return on investment is recommended across all rental inventory to maintain profitability. This target accounts for insurance, labor, maintenance, and replacement costs throughout the equipment lifecycle. Premium-positioned rentals with strong aesthetic differentiation support higher margins than commodity-priced basic units.
How Do Age Differences Affect Rental Preferences Within 4-12 Year Olds?
Younger children ages 4-6 prefer enclosed bounce houses with safety netting and accessible entry points. Older children ages 10-12 seek thrill-based options like tall water slides and obstacle courses. This age segmentation requires rental operators to maintain diverse inventory.
Equipment size and complexity requirements increase proportionally with child age within the 4-12 range. Mixed-age parties benefit from combo units that provide separate zones for different developmental stages. Understanding these distinctions helps rental businesses optimize inventory investment and booking conversion.
What Are the Distinct Preferences for Younger vs. Older Children in This Range?
Children ages 4-6 prioritize safety features like low sidewalls and gentle bounce surfaces. Older children ages 10-12 prefer challenge-based elements, including climbing walls and competitive games. Understanding age groups for a 40 ft inflatable obstacle course rental business explores these developmental differences in equipment selection.
Theme preferences also vary significantly across the age spectrum. Younger children favor character-based themes like princesses and dinosaurs, while pre-teens seek generic designs. Rental operators serving this full range require inventory diversity that addresses both segments.
How Do Gift, Family Time, and Entertainment Priorities Vary by Age?
Children rank gifts highest at 41%, followed closely by family time and entertainment. However, entertainment priority increases with age as peer social dynamics become more influential. Older children within the 4-12 range place a higher value on games and interactive entertainment.
Younger children prioritize family presence and traditional celebration elements like cake and decorations. The shift toward entertainment focus peaks around ages 8-10 when social comparison intensifies. These priority variations inform how rental businesses market equipment to different age segments.
To What Extent Do Children Influence Purchase Decisions for Rentals?
Children directly influence 90% of household purchase decisions, including party planning and rental selections. This influence extends beyond simple preference expression to active participation in vendor selection. Parents frequently involve children in reviewing rental options through online galleries and video demonstrations.
The high influence rate confirms that marketing materials must appeal to both parents and children. Visual presentation, theme options, and entertainment features drive child preference formation. Rental operators who recognize dual decision-maker dynamics achieve higher conversion rates.
What Role Do Safety and Quality Play in Parental Rental Choices?
Safety scored 92 out of 100 in consumer priority rankings for party rental decisions. This represents the highest priority factor ahead of entertainment value, equipment quality, and cost. How are safety concerns addressed in equipment selection, certification standards, and inspection protocols that reassure parents?
Equipment quality ranked 85 out of 100, significantly outpacing cost considerations at 78. This data indicates parents willingly pay premium prices for demonstrably safe and well-maintained equipment. Rental operators who emphasize child safety certifications and maintenance protocols differentiate effectively from budget competitors.
How Are Safety Concerns Addressed in Equipment Selection?
Safety scored 92/100, entertainment value 88/100, and equipment quality 85/100 in parent priorities. Convenience ranked 80/100 while cost ranked lowest at 78/100 among major decision factors. These rankings confirm that safety-focused marketing messages resonate more strongly than price-based appeals.
Parents specifically seek NFPA 701 flame resistance compliance and equipment with documented inspection histories. Visible wear, fading, or maintenance issues immediately disqualify rental options regardless of pricing. Investment in high-quality equipment with safety certifications provides measurable competitive advantages.
Why Is Equipment Quality a Top Priority Over Cost?
Approximately 62% of event planners prioritize equipment quality and aesthetic appeal over cost. This preference reflects broader consumer trends toward experience quality over price sensitivity. Well-maintained equipment with vibrant colors and structural integrity commands premium pricing.
Parents associate equipment condition with operational safety and business professionalism. Faded colors or visible repairs trigger concerns about overall maintenance standards and liability. Maximize rental profits with high-demand bounce house combos demonstrates how quality investment supports premium positioning.
How Does Convenience Factor Into Rental Decision-Making?
Convenience scored 80 out of 100 in consumer priority rankings. Parents prioritize rental companies offering delivery, setup, and takedown services within quoted prices. Online booking systems with instant availability confirmation also enhance perceived convenience.
Digital payment options and flexible cancellation policies reduce friction in the booking process. Time-stressed parents value turnkey solutions that eliminate logistical complexity from celebration planning. Rental operators who streamline customer experience through technology and service bundling capture a larger market share.
How Does the Rental Landscape Differ Between Urban and Rural Markets?
Urban regions experienced a 38% increase in rental demand over recent measurement periods. Higher population density, limited home storage space, and elevated disposable incomes drive metropolitan growth. Urban families also demonstrate lower price sensitivity compared to rural counterparts.
Rural markets show higher price sensitivity but also present opportunities for operators with mobility. Geographic factors, including property size, venue access, and travel distance, significantly influence inventory selection. Understanding these regional dynamics helps rental businesses optimize service areas and pricing.
What Trends Are Driving Higher Demand in Urban Areas?
Urban regions saw a 38% increase in rental demand due to population density and income levels. Metropolitan families lack storage space for purchasing entertainment equipment, increasing rental dependency. Higher disposable incomes in urban markets also support premium pricing for quality entertainment.
Social media influence concentrates in urban areas where peer comparison drives elaborate celebration spending. Limited backyard space in urban settings increases demand for vertical entertainment like tall water slides. These factors create favorable conditions for premium-positioned rental operators.
What Opportunities Exist in Rural or Suburban Regions?
Higher price sensitivity characterizes rural markets compared to urban counterparts. However, rural properties typically offer larger outdoor spaces suitable for oversized inflatable equipment. This geographic advantage creates opportunities for operators offering unique, large-scale entertainment options.
Rural families may travel further for specialized equipment unavailable from local competitors. Operators willing to extend service areas capture underserved markets with reduced competitive pressure. Party rental business plan for stay-at-home parents explores strategies for entering emerging markets.
How Do Geographic Factors Influence Rental Inventory Choices?
Property size and venue access significantly influence which equipment types achieve the highest utilization rates. Urban operators prioritize compact combo units that fit standard residential lots and require minimal setup space. Rural operators can stock larger obstacle courses and water slides suitable for spacious properties.
Climate variations across regions affect seasonal demand patterns and equipment type preferences. Southern markets maintain year-round demand while northern regions concentrate bookings between May and September. Inventory strategies must align with local climate conditions and property characteristics.
What Insights Can Be Drawn From Comparing Birthday Parties to Other Family Celebrations?
Birthday party rental budgets average $314 compared to $1,128 for 60-person graduation celebrations. This comparison reveals milestone events command significantly higher spending per celebration despite similar entertainment requirements. The guest count differential explains much of the budget variation.
Typical birthday parties host 15-20 children, while graduation parties accommodate 50-100 guests total. However, per-guest entertainment spending remains higher for children's birthdays, given their longer engagement duration. These insights inform how rental operators allocate inventory across celebration categories.
How Do Birthday Rentals Contrast With Milestone Event Rentals Like Graduations?
The average cost for a 60-person graduation party is $1,128, versus $314 for birthdays. Milestone event rentals range from $300 to $550+ for mid-range to premium equipment. Graduation parties typically host 50-100 people compared to 15-20 children at birthday celebrations.
Graduation celebrations show less theme specificity but higher demand for large-capacity entertainment options. Birthday celebrations prioritize themed aesthetics and age-appropriate safety features over throughput capacity. Understanding these distinctions helps rental operators position inventory effectively.
What Seasonal Dynamics Impact Rental Demand for Kids' Parties?
Approximately 60% of annual commercial bounce house and water slide revenue concentrates in the summer months. Highly seasonal demand peaks in May-June for graduations before transitioning to birthday celebrations. This seasonal concentration requires strategic inventory planning and revenue management.
Birthday parties maintain more consistent year-round demand compared to graduation events' concentrated seasonality. Indoor venue rentals and weather-resistant equipment extend earning potential into shoulder seasons. Operators balancing seasonal inventory across celebration types smooth revenue fluctuations.
Which Rental Categories Represent the Biggest Growth Opportunities?
The Bounce House with Slide sub-segment is growing at 6.48% CAGR through 2034. Experience-based party rentals overall are expanding at 18% year-over-year versus traditional celebrations. These growth rates indicate where rental operators should prioritize inventory investment.
Water slides show particularly strong performance during peak seasonal months with premium pricing capability. Themed combo units that serve the 4-12 age range maintain consistent demand across seasons. Operators who align inventory with these high-growth categories maximize return on equipment investment.
How Are Parents Booking and Planning Birthday Party Rentals for 2026?
Parents primarily book rentals through online platforms that display availability and pricing transparently. Digital booking systems have replaced phone inquiries as the preferred initial contact method. Visual galleries showing equipment in actual party settings significantly influence rental selection.
Social media platforms, particularly Pinterest, serve as primary inspiration sources during planning phases. Parents research options weeks in advance but often finalize bookings within 7-14 days of celebrations. Understanding this timeline helps rental operators optimize marketing and inventory allocation.
What Is the Typical Party Size and Venue Type for These Rentals?
Typical birthday party size is 15-20 children for the 4-12 age range. Backyard celebrations remain most common, followed by park pavilions and community center rentals. Venue type significantly influences which equipment sizes and configurations parents select.
Residential backyards typically accommodate standard 13x13 or 15x15 bounce houses without space constraints. Larger venues like parks enable booking multiple entertainment options, including water slides and obstacle courses. Rental operators should ask about venue specifications during booking to ensure equipment compatibility.
Which Influences Shape Rental Budgets and Spending Limits?
American parents spend $15.8 billion annually on birthday parties across all age ranges. Millennial parents allocate 23% more budget than Generation X and 45% more than Baby Boomers. This generational spending pattern indicates where rental operators find the highest-value customer segments.
Social media influence and peer comparison significantly shape budget allocation toward visible entertainment elements. Parents justify higher spending when celebrations create shareable moments and lasting memories. Equipment that photographs well commands premium pricing due to enhanced perceived value.
How Are Digital Platforms and Rental Technology Affecting Bookings?
Online booking systems with instant availability confirmation have become standard customer expectations in 2026. Digital platforms displaying equipment photos, specifications, and safety certifications reduce phone inquiry volume. Mobile-optimized booking flows capture customers during initial inspiration and research phases.
Automated payment processing and digital contracts streamline transaction completion and reduce administrative overhead. Rental management software enables operators to optimize inventory utilization and dynamic pricing. Technology adoption separates professional operators from informal competitors.
2026 Birthday Party Rental Trends for Kids Ages 4-12 in the Evolving Private Celebration Market
The global party equipment rental market is valued at $18.4 billion in 2025. Market projections indicate growth to $31.2 billion by 2034 at a 6.4% CAGR. The party supply rental market is growing at 11.2% CAGR from $15.2 billion in 2023 to $32.0 billion by 2030.
The US party supply rental industry is projected to generate $8.5 billion in revenue in 2026. This growth reflects sustained consumer demand for professional-grade entertainment at private family celebrations. Rental operators who understand parent preferences, prioritize child safety, and invest in high-quality themed equipment are positioned to capture expanding market opportunities.
Parents continue prioritizing elaborate, experience-based celebrations that create lasting memories for children ages 4-12. The combination of Millennial spending power, social media influence, and child decision-making authority drives premium rental demand. Businesses like JumpOrange support this market by providing safety-certified equipment that meets both parents' expectations and child entertainment preferences.
Ready to Stock What Parents Are Actually Booking?
The data is clear: parents in 2026 are spending more, booking themed inflatables, and choosing rental operators with professional-grade equipment. If your inventory still relies on basic bounce houses, you're leaving bookings on the table.
JumpOrange carries the combo units, large water slides, and themed designs that match exactly what families are searching for this year. Commercial-grade quality, exclusive designs, and the JEM Club benefits to help you price, market, and scale. Ready to stock the high-demand equipment parents are booking for 2026 celebrations? Explore our complete selection of bounce house combos designed for profitable rental operations.



Leave a comment
This site is protected by hCaptcha and the hCaptcha Privacy Policy and Terms of Service apply.