
The inflatable rental industry generates USD 4.46 billion annually, with projected growth to USD 6.43 billion by 2034. Revenue follows predictable seasonal patterns, with Q2 and Q3 producing 65% of annual income while Q1 and Q4 create challenging financial gaps. Operators who master inflatable cash flow management through strategic reserve allocation, dynamic pricing, and KPI tracking sustain profitability year-round.
Successful rental businesses partnering with reliable bounce house manufacturing solutions online recognize that seasonal revenue gaps require proactive financial planning, not reactive cost-cutting. Budget smoothing techniques, inventory diversification, and off-season financing strategies separate thriving operators from those who struggle each winter. Understanding market dynamics and performance metrics enables accurate income forecasting and effective resource allocation during peak and slower months.
Key Takeaways
- Q2 and Q3 generate 65% of annual revenue, requiring strategic reserve fund planning for slower quarters
- Premium water slides deliver 77% profit margins compared to 57% for standard units, accelerating ROI timelines
- Maintain emergency reserves of $2,500-$5,000 and direct 15% of peak earnings to off-season financing
- Target Asset Utilization Rate above 60% during peak months and track CAC below $50 for sustainable growth
- Diversify inventory with indoor-friendly rentals and complementary services to bridge seasonal revenue gaps
What Drives Income Fluctuations in Inflatable Rental Businesses?
Revenue volatility stems from three factors: seasonal demand patterns, consumer preferences, and equipment-specific performance. Q2 generates 35% of annual revenue while Q3 produces 30%, creating concentrated income periods. Q1 accounts for 20%, and Q4 contributes 15%, establishing the core challenge of managing seasonal revenue gaps.
Peak season demonstrates 45% higher rental activity compared to the off-season baseline. Water slides generate 40% higher revenue during summer than standard bounce houses. Weather dependency affects outdoor rentals significantly, forcing operators to develop indoor alternatives and complementary services.
How Does Seasonality Impact Rental Revenue?
Quarterly revenue distribution follows a predictable bell curve centered on spring and summer. April through September account for 65% of total annual income, requiring disciplined reserve fund management. Operators must capture and retain peak earnings to cover fixed expenses during slower quarters.
Winter months present dual challenges of reduced demand and increased equipment maintenance needs. Storage costs, repair expenses, and marketing investments continue regardless of booking volume. Successful operators anticipate this pattern during Year 1 and build financial buffers before experiencing their first off-season.
What Are Common Consumer Preferences Affecting Cash Flow?
Individuals represent 36.88% of the market share, establishing the foundation for weekend entrepreneur operations. The event planner segment projects growth at 12.4% CAGR from 2024 to 2030. Established businesses achieve 30-40% repeat bookings, reducing customer acquisition costs and stabilizing inflow cash flow patterns.
Consumer preferences shift seasonally, with water attractions dominating summer demand and indoor inflatables gaining traction during cooler months. Diversifying inventory with all-season equipment smooths revenue distribution across quarters. Weather-dependent outdoor rentals require contingency planning and flexible cancellation policies that protect both customer relationships and operator revenue.
Which Key Performance Indicators Reflect Financial Health?
Average Rental Value measures revenue per booking and should exceed $197-$400, depending on equipment mix. Gross Margin Percentage calculates profitability after direct variable costs, including fuel, cleaning, and labor. Target GM% should reach 75% or higher to sustain operations during slower periods.
Asset Utilization Rate quantifies how often inventory generates revenue versus sitting idle. Peak season AUR should exceed 60% utilization to justify equipment investment and maximize return. Customer Acquisition Cost and Delivery Efficiency provide additional insights into operational sustainability and scaling potential.
How Do Inflatable Rental Operators Track and Manage Finances?
Financial tracking requirements vary based on business scale and operational complexity. Weekend entrepreneurs prioritize simplicity and low-cost solutions while full-time operators need comprehensive systems. Software adoption rates reflect this divide: 68% of weekend entrepreneurs versus 85% of full-time operators use specialized management platforms.
Selection criteria center on ease of bookkeeping (92% priority), KPI tracking capabilities (88%), and cash flow management features (85%). Inventory control (80%) and customer management (78%) round out the top priorities. Understanding these priorities helps operators select appropriate tools without overspending on unnecessary features during early growth stages.
What Bookkeeping Practices Suit Weekend Entrepreneurs?
Weekend entrepreneurs operate side hustles or part-time rental businesses with limited transaction volumes. Simple bookkeeping systems like QuickBooks Self-Employed and Wave cost $0-$50 monthly and handle basic income tracking. These platforms lack inventory management and routing features but meet initial needs effectively.
Budget constraints and lower transaction volumes make basic bookkeeping sufficient for operators managing fewer than five units. Ease of bookkeeping receives priority from 92% of operators, justifying the focus on user-friendly interfaces. As rental volume increases, weekend entrepreneurs transition to specialized event rental software with more robust capabilities.
Which Software Solutions Support Rental Management?
Event rental management software, including Rentman, Renta, and EZRentOut, provides industry-specific features for growing operations. These platforms offer inventory control, real-time availability tracking, contract management, and integrated payment processing. The steeper learning curve and higher monthly costs ($39-$150) require operators to assess whether transaction volume justifies the investment.
Full-time operators demonstrate 85% adoption rates of comprehensive software compared to 68% among weekend entrepreneurs. Managing logistics efficiently requires centralized systems that scale with business growth. ERP systems exceed $150-$800 monthly and demand significant setup time, making them appropriate only for established multi-location operations.
How Do Pricing Structures Vary Across Software Options?
Simple bookkeeping platforms range from $0-$50 monthly, while event rental software costs $39-$150 monthly. ERP systems start at $150 and extend beyond $800 for enterprise solutions. Renta offers custom pricing around $50 monthly with a 9.0/10 overall rating for all-in-one inventory and reservations.
Rentman charges $39 plus add-ons with an 8.6/10 score for strong stock control features. Platform selection should align with current transaction volume rather than anticipated future needs. Starting with basic bookkeeping and upgrading as revenue grows prevents unnecessary expense while ensuring adequate financial visibility.
What Strategies Help Bridge Income Gaps Between Peak and Off-Season?
Three core strategies enable operators to navigate seasonal fluctuations: dynamic pricing, inventory diversification, and reserve management. Early booking incentives during slow months maintain consistent revenue without eroding premium margins. Competing solely on price collapses profit margins from 77% down to 57%, sacrificing thousands in annual income.
Underpricing represents a common mistake that undermines long-term profitability. Strategic discounts target specific slow periods while preserving standard rates during peak demand. Reserve fund allocation during high-earning months creates financial cushions that sustain operations when bookings decline.
How Can Dynamic Pricing Support Revenue Stability?
Offering early booking incentives during slow months encourages advance reservations without permanent price reductions. Seasonal promotions should target specific weeks or months rather than applying blanket discounts year-round. This maintains perceived value while generating off-season financing through advance bookings.
Premium pricing during peak months funds operations during slower quarters when properly allocated to reserves. Pricing combo bounce houses optimally preserves margins while remaining competitive in local markets. Dynamic pricing algorithms adjust rates based on demand patterns, local competition, and equipment-specific utilization rates.
What Role Does Inventory Diversification Play Off-Season?
Indoor-friendly rentals, including soft plays, bubble houses, tables, and chairs, generate revenue regardless of outdoor weather conditions. Winter birthday parties and indoor corporate events create demand for weather-independent equipment. Diversification reduces dependency on seasonal outdoor attractions and stabilizes monthly income.
Equipment mix should balance high-margin premium items with consistent-booking standard units for optimal year-round performance. Indoor venues prefer inflatable options that fit ceiling heights and require minimal setup space. Understanding startup costs helps operators budget for diversified inventory that supports budget-smoothing objectives.
How Should Emergency Funds and Reserves Be Managed?
Directing 15% of peak season revenue to emergency funds creates financial buffers for unexpected expenses and slow months. Operators should maintain $2,500-$5,000 specifically for insurance deductibles and emergency equipment repairs. Commercial liability insurance costs $2,400-$6,000 annually and represents a non-negotiable fixed expense.
Reserve fund management separates successful operators from those who struggle during seasonal downturns. Peak earnings must cover both immediate operational expenses and future off-season costs through disciplined allocation. Emergency reserves prevent operators from accepting underpriced bookings out of desperation during slower quarters.
How Do Fleet Composition and Pricing Affect Profitability?
Equipment selection directly impacts both revenue potential and profit margins throughout the operating year. Standard bounce houses average $185 profit per booking with 57% margins, while premium water slides generate $732 per booking at 77% margins. Premium equipment achieves ROI in 4-6 months compared to 8-12 months for standard units.
Optimal fleet composition balances consistent-booking standard items with high-margin premium equipment for maximum annual revenue. Adding 2-4 units during Year 2 expansion increases earning potential while managing investment risk. Building a six-figure annual revenue requires strategic equipment selection aligned with local market demand patterns.
What Is the Optimal Equipment Mix for Revenue Generation?
Standard bounce houses provide reliable bookings and steady cash flow throughout operating seasons. Premium water slides command higher rental rates and generate significantly better margins during peak summer months. Recommended fleet composition includes 60% standard units, 25% water attractions, and 15% specialty items.
This distribution ensures consistent booking opportunities while maximizing revenue during high-demand periods when premium equipment justifies elevated pricing. Year 2 expansion should add 2-4 units based on utilization data from Year 1 operations. Equipment diversity also protects against market saturation in any single rental category.
Why Is Delivery Pricing Crucial for Cash Flow?
Delivery fees range $50-$200 per event, depending on distance and labor requirements. Absorbing delivery costs surrenders 15-25% of potential revenue unnecessarily, undermining overall profitability. Distance-based pricing ensures operators recover actual transportation and setup expenses while maintaining competitive rates.
Labor costs for delivery teams represent significant variable expenses that must be covered through appropriate fee structures. Converting school parents into repeat clients becomes easier when transparent pricing demonstrates value beyond equipment rental. Delivery fees should be calculated separately and clearly communicated during booking.
How Do Premium Rentals Influence Profit Margins?
Premium equipment delivers 77% margins compared to 57% for standard rentals, creating substantial profitability differences over time. ROI timelines differ dramatically: premium units recover investment in 4-6 months versus 8-12 months for standard equipment. Summer water slides generate 40% higher revenue than traditional bounce houses during peak months.
Premium positioning requires matching equipment quality with professional service standards and appropriate pricing strategies. Operators cannot achieve premium margins with standard equipment regardless of service quality or marketing efforts. Strategic investment in high-margin equipment accelerates the path to six-figure annual revenue when combined with effective operations.
How Can Rental Operators Use KPIs to Forecast and Improve Cash Flow?
Critical KPIs provide quantifiable metrics for assessing financial health and operational efficiency throughout the business year. KPI tracking receives priority from 88% of operators, while cash flow management ranks at 85%. Regular monitoring enables operators to identify problems early and adjust strategies before minor issues become major challenges.
Data-driven decision making separates successful long-term operators from those who rely on intuition. Establishing target benchmarks for each KPI creates clear performance standards and accountability. Consistent tracking builds historical data that improves the accuracy of seasonal forecasting and strategic planning.
What Are Critical KPIs for Rental Income and Utilization?
Target Average Rental Value should exceed $197-$400 per booking, depending on local market conditions and equipment mix. Gross Margin Percentage must reach 75% or higher to sustain operations during off-season months. Asset Utilization Rate during peak season should exceed 60% to justify equipment investment and maximize earning potential.
These three metrics collectively indicate whether pricing strategies, equipment selection, and marketing efforts align with profitability objectives. Low ARV suggests underpricing, while poor GM% indicates high variable costs or inadequate fee structures. Suboptimal AUR reveals insufficient marketing reach or booking system inefficiencies requiring immediate attention.
How Can Operators Monitor Customer Acquisition Costs Effectively?
Target Customer Acquisition Cost should remain at $50 or lower to maintain sustainable growth margins. CAC calculation includes all marketing expenses, advertising costs, and promotional discounts divided by the new customers acquired. Rising CAC indicates market saturation, ineffective marketing channels, or increased local competition requiring strategic adjustments.
Seasonal income management becomes easier when CAC remains controlled and repeat booking rates increase over time. Established operators with 30-40% repeat customers enjoy lower overall CAC and more predictable revenue. Customer management systems prioritized by 78% of operators help track acquisition sources and optimize marketing spending.
What Metrics Assess Delivery Efficiency and Labor Costs?
Target Delivery Efficiency should remain below 40 hours for standard weekly operations to control labor expenses. Crew productivity directly impacts profitability by reducing variable costs per rental while maintaining service quality. Route optimization and efficient scheduling minimize drive time and maximize deliveries per day.
Labor represents one of the largest variable expenses in rental operations after equipment acquisition costs. Tracking hours per rental reveals opportunities to streamline setup processes and improve operational efficiency. Delivery efficiency improvements directly increase profit margins without requiring price increases or additional marketing investment.
What Are the Best Practices for Seasonal Financial Planning in Inflatable Rentals?
Quarterly revenue allocation requires understanding that Q2 and Q3 generate 65% of annual income collectively. Operators must resist increasing personal draws during peak months without adequate reserve allocation. Annual hidden expenses total $15,000-$25,000, including storage, maintenance, marketing, and insurance costs, regardless of booking volume.
Strategic financial planning anticipates fixed expenses during slow periods and allocates peak earnings accordingly through systematic budget smoothing. Off-season services supplement rental income while maintaining customer relationships and brand visibility during slower booking periods. Maintenance costs increase during winter when equipment undergoes repair and preparation for the following season.
How Should Quarterly Revenue Be Allocated?
Q2 generates 35% of annual revenue while Q3 produces 30%, creating the financial foundation for the entire year's operations. Combined 65% concentration demands disciplined allocation to reserves rather than immediate spending. Q1 and Q4 together produce only 35% of annual income, making them dependent on accumulated reserves.
Peak quarter earnings must cover both current operational expenses and future fixed costs during anticipated slow periods. Operators should calculate total annual expenses and divide by four to determine the minimum quarterly reserve allocation. Any peak earnings exceeding this quarterly minimum should be retained for emergency reserves before considering profit distributions.
Which Off-Season Services Supplement Income?
Party planning services leverage existing customer relationships and event expertise without requiring significant equipment investment. Equipment maintenance for other operators generates supplemental income while utilizing existing repair skills and storage space. Moving services employ delivery crews and transportation assets during periods when rental bookings decline.
Complementary services maintain brand visibility and customer engagement during slow months. Service diversification requires minimal additional overhead while generating revenue streams independent of weather conditions. Off-season financing through alternative services reduces reliance on reserve funds and extends equipment longevity through consistent business activity.
How to Prepare for Hidden and Maintenance Costs?
Annual hidden expenses range $15,000-$25,000 including storage facilities, routine maintenance, digital marketing, and commercial liability insurance. Storage costs continue year-round regardless of booking volume or seasonal demand fluctuations. Marketing expenses must be maintained during slow months to ensure strong bookings when peak season returns.
Budgeting for hidden costs prevents financial surprises and ensures adequate capital allocation.
Maintenance expenses increase during the off-season when equipment undergoes thorough inspection and repair before the following peak season. Insurance premiums remain constant throughout the year and represent non-discretionary fixed expenses that must be covered regardless of revenue.
How Does Demographic and Market Variation Influence Cash Flow Management?
Software adoption patterns vary significantly across operator demographics and operational scales, affecting financial management capabilities. Weekend entrepreneurs show 68% adoption rates compared to 85% for full-time operators due to budget constraints and transaction volumes. Geographic location significantly impacts both market opportunity and technology adoption rates across rental operations.
Understanding demographic differences enables operators to select appropriate financial tools and realistic growth expectations based on market position. Urban operators access larger customer bases while rural operators often serve smaller but potentially underserved markets. Technology adoption correlates with operational scale, market density, and operator experience.
How Do Weekend Entrepreneurs Differ from Full-Time Operators?
Weekend entrepreneurs managing 1-5 units prioritize simple bookkeeping and minimal overhead expenses during initial growth phases. Full-time operators running larger fleets require comprehensive inventory management and sophisticated financial tracking. The 68% versus 85% software adoption gap reflects different operational needs and available budgets.
Part-time operators often maintain other income sources, reducing pressure to generate consistent monthly revenue from rentals alone. Full-time dependence on rental income demands more sophisticated cash flow management and reserve fund strategies. Both operator types benefit from understanding seasonal patterns, but full-time businesses face greater financial risk during slow periods.
What Are Urban Vs. Rural Adoption Patterns for Financial Tools?
Urban operators demonstrate 72% software adoption rates while rural operators show only 45% utilization of specialized management platforms. Market density in urban areas justifies technology investment through higher transaction volumes and competitive pressure. Rural operators may achieve profitability with simpler systems due to less competition and lower customer acquisition costs.
Geographic differences affect not only software adoption but also seasonal patterns, pricing strategies, and equipment preferences across markets. Urban markets offer year-round event opportunities, while rural areas may show more pronounced seasonal fluctuations. Technology adoption should align with actual business complexity rather than perceived industry best practices.
Which Consumer Priorities Impact Software and Operations Selection?
Inventory control receives priority from 80% of operators, while customer management ranks at 78% importance. These priorities directly influence software selection decisions and implementation timelines. Operators must balance feature requirements against budget constraints and learning curve considerations when selecting management platforms.
Feature prioritization should reflect current operational challenges rather than anticipated future needs to avoid paying for unused capabilities. As businesses scale from weekend operations to full-time enterprises, technology needs evolve, requiring periodic reassessment. Starting with essential features and upgrading strategically prevents both overspending and operational bottlenecks.
Inflatable Rental Cash Flow Management: Synthesizing Market, Operational, and Financial Insights
The global bounce house market, valued at USD 4.46 billion in 2025, will reach USD 6.43 billion by 2034. The broader party supply rental market expects growth from USD 20.45 billion in 2023 to USD 32.02 billion by 2030. This 11.2% CAGR demonstrates sustained demand for inflatable rentals and related event services across global markets.
Year 1 operators typically generate $25,000-$50,000 revenue with 8-12 units requiring $15,000-$40,000 initial investment. Established businesses achieve 30-40% repeat booking rates, reducing customer acquisition costs while stabilizing revenue patterns. Strategic equipment selection, disciplined financial management, and understanding seasonal patterns enable operators to build sustainable six-figure rental businesses.
Managing inflatable cash flow successfully requires coordinating multiple strategic elements: disciplined reserve fund allocation, dynamic pricing that preserves margins, diversified inventory for year-round revenue, and systematic KPI tracking. Operators who master budget smoothing techniques and off-season financing strategies sustain operations during challenging quarters while maximizing peak season profitability. Understanding that Q2 and Q3 produce 65% of annual revenue enables realistic financial planning and appropriate resource allocation.
JumpOrange has supported rental operators since 2002 with quality equipment, safety certifications, and strategic business guidance. Their distribution network in California and Florida ensures reliable access to both standard and premium inventory. The JEM Club offers business advantages, including discounts and expert consultation, that help operators optimize fleet composition and financial performance.
Build a Rental Business That Earns Year-Round
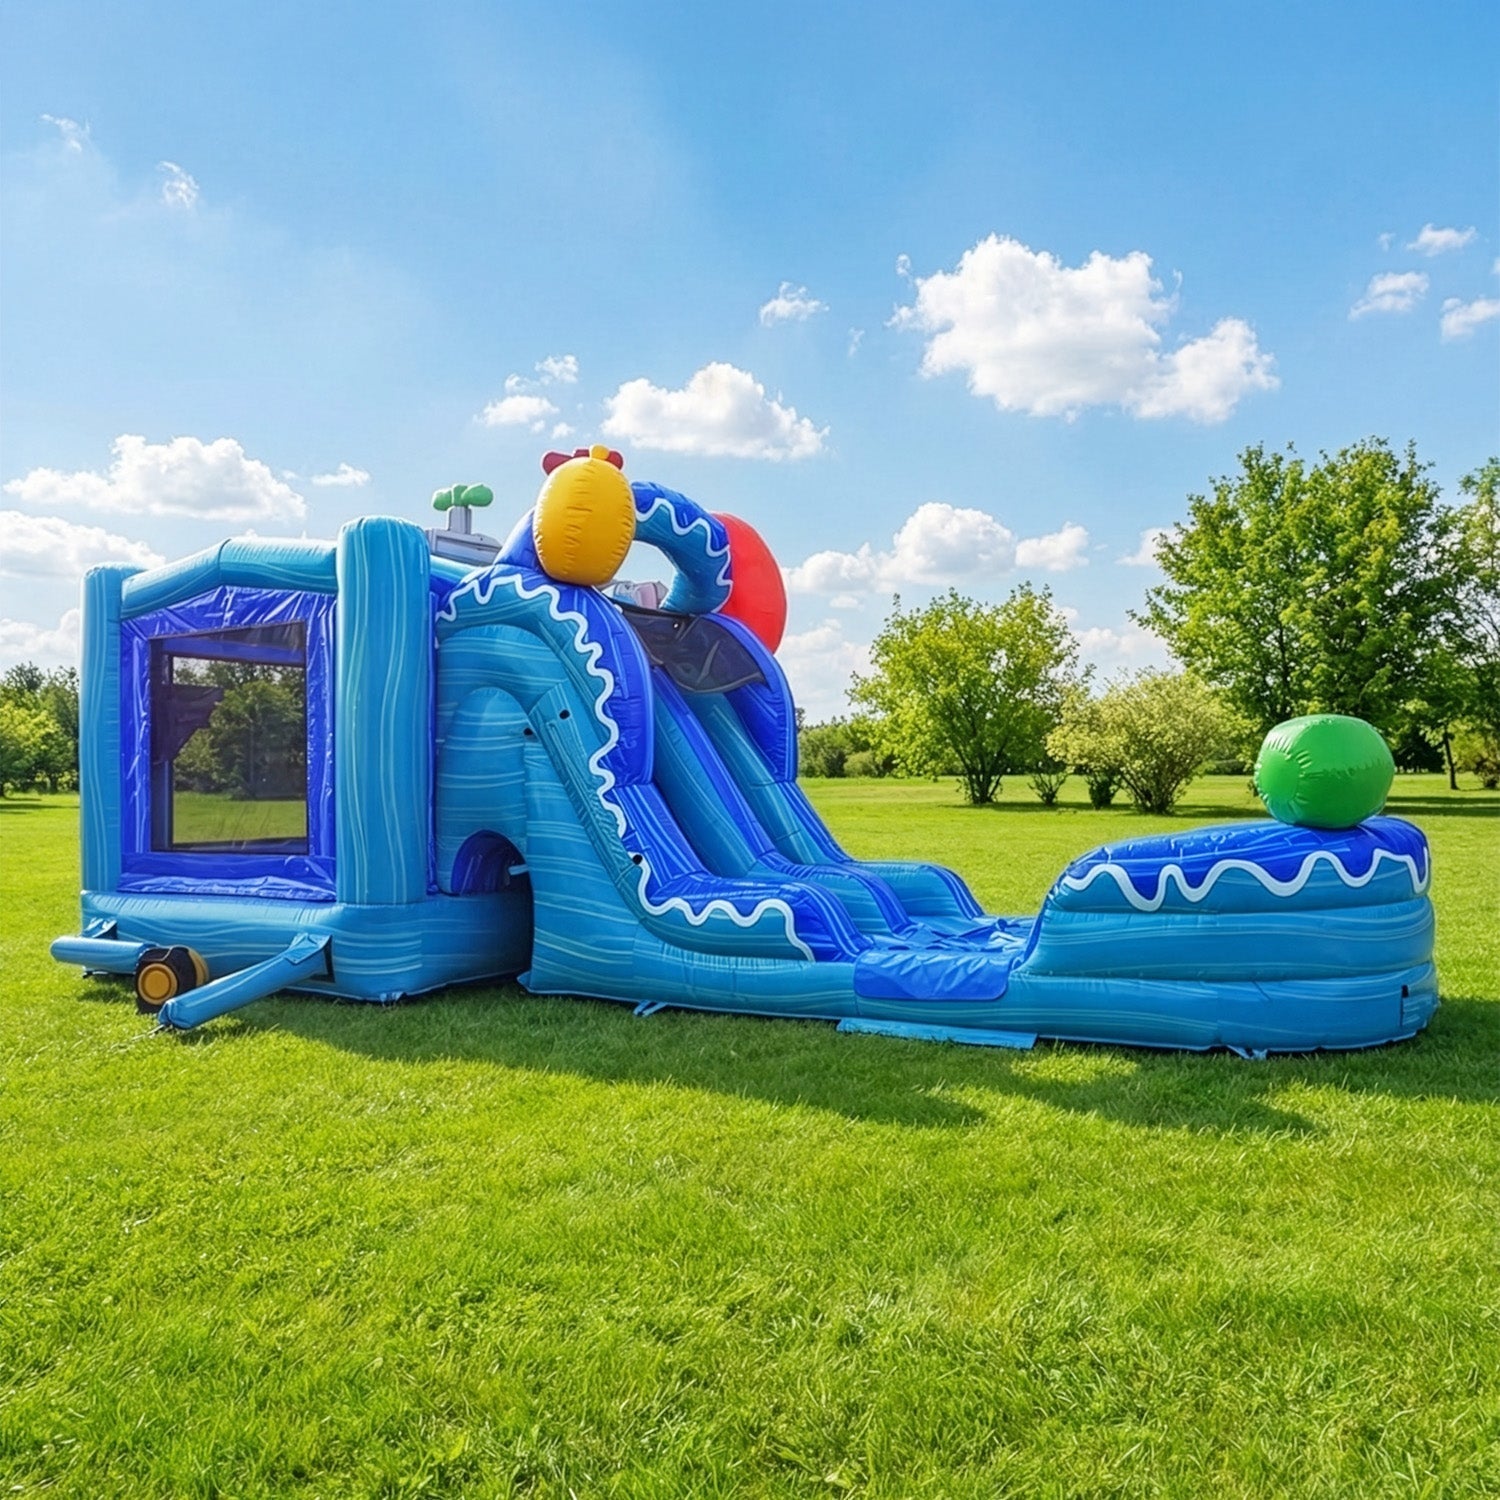
Strong cash flow starts with equipment that keeps booking through every season. JumpOrange has helped rental operators build profitable, durable fleets since 2002, with commercial-grade inflatables including bounce house water slide units, safety certifications, and a California and Florida distribution network that keeps your inventory moving. Join the JEM Club for member discounts, free shipping on qualifying orders, and expert guidance on fleet composition and ROI. Explore the JumpOrange collection and set your business up to thrive in peak season and stay steady through the slow months.



Leave a comment
This site is protected by hCaptcha and the hCaptcha Privacy Policy and Terms of Service apply.