
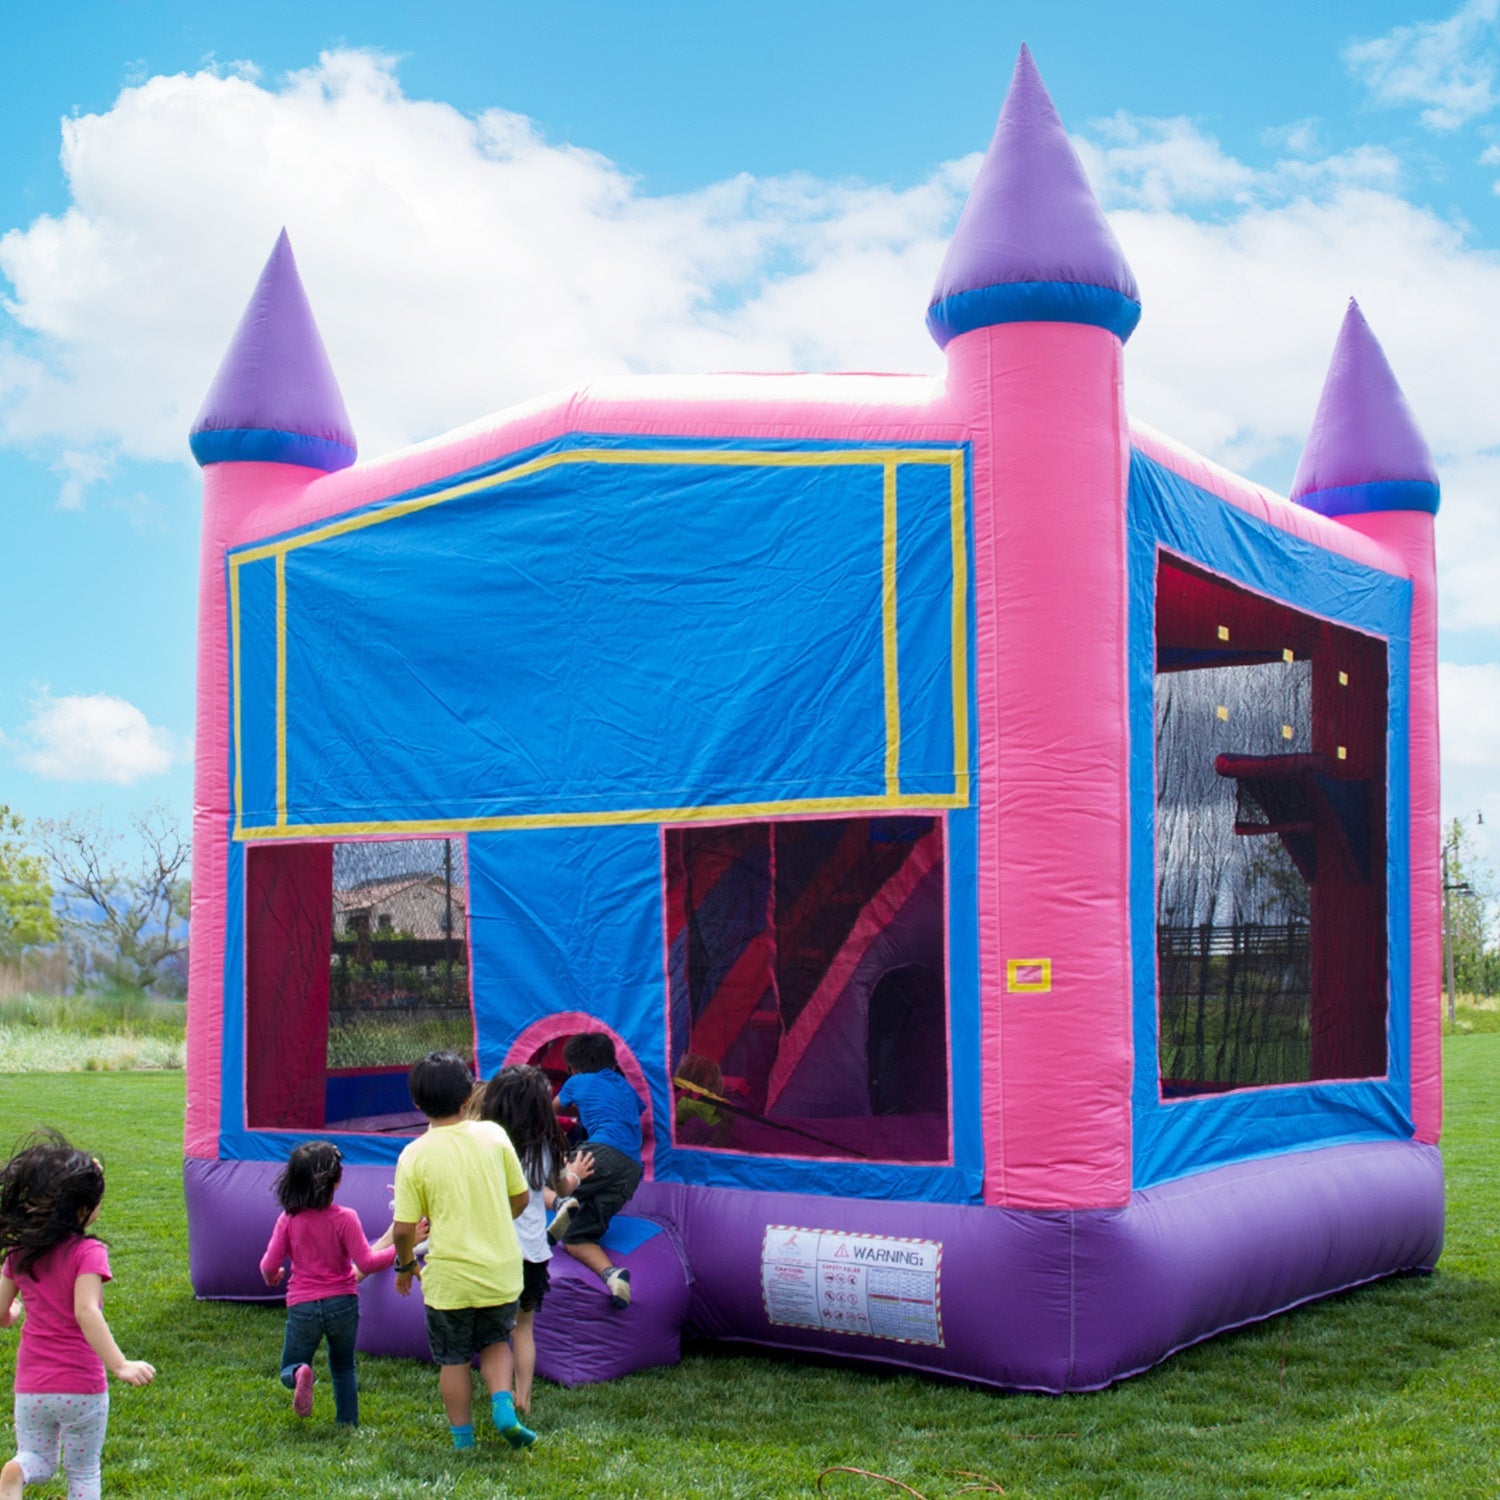
Setting accurate rental rates determines whether inflatable rental businesses achieve sustainable profitability or struggle with cash flow problems. Operators must balance equipment costs, operational expenses, market demand, and competitor pricing while maintaining margins that support long-term growth. A structured approach to bounce house pricing helps rental entrepreneurs maximize revenue during peak seasons and maintain financial stability during slower months.
The choice between cost-plus and value-based pricing shapes every aspect of a rental business. Cost-plus models ensure cost recovery but may leave revenue untapped during high-demand periods. Value-based approaches capture market premiums but require constant monitoring of competitor rates and consumer willingness to pay.
Key Takeaways
- Cost-plus pricing adds a 100-300% markup to equipment costs while value-based pricing aligns rates with customer demand and competitor analysis
- Classic bounce houses represent 38% of market share with equipment costs between $1,395 and $2,995
- Hidden operational costs range from $15,000 to $25,000 annually, with 72% of new operators underestimating expenses by 30-40%
- Peak season accounts for 75% of annual expenses, while water slides generate 40% higher revenue during summer months
- Section 179 deductions allow operators to deduct the full purchase price of equipment in the year placed in service
What Are Cost-Plus and Value-Based Pricing Models?
How Does Cost-Plus Pricing Work in Bounce House Rentals?
The cost-plus model calculates total ownership expenses and applies a markup percentage to determine rental rates. Operators using this approach add 100-300% to the combined cost of equipment purchase, maintenance, insurance, and storage. This method guarantees cost recovery and provides predictable profit margins regardless of market conditions.
Fixed markup percentages simplify rate setting but ignore demand fluctuations that affect rental income potential. A bounce house with a $2,000 equipment cost and $500 annual operating expenses might rent for $200-$500 per event using standard industry markups. While this ensures profitability on each rental, it may undervalue premium units during high-demand weekends or overprice basic units during slower periods.
What Defines Value-Based Pricing for Inflatable Rentals?
Value-based pricing sets rates according to perceived customer value, competitor analysis, and current market demand. This strategy allows operators to charge premium rates for sought-after equipment types and adjust pricing based on event type, booking timing, and seasonal factors. The approach requires continuous market research but typically generates higher revenue than fixed markup methods.
Rental businesses employing value-based pricing analyze competitor rates, monitor booking patterns, and adjust prices dynamically throughout the year. A 13x13 classic bounce house might rent for $150 during a slow weekday in March but command $250 for a Saturday afternoon in June. This flexibility maximizes revenue during peak periods while maintaining competitive positioning during off-peak months.
What Are the Key Differences Between These Approaches?
Cost-plus pricing prioritizes cost recovery and operational stability through predictable margins. Value-based pricing prioritizes revenue maximization and market responsiveness through flexible rate adjustments. The cost-plus model suits new operators establishing baseline profitability, while the value-based approach benefits experienced businesses with established customer bases and competitive intelligence.
Combining both methods creates balanced pricing strategies that protect minimum margins while capturing premium opportunities. Operators set cost-plus floors to ensure every rental covers expenses, then apply value-based adjustments based on demand signals like booking frequency, event type, and seasonal timing. This hybrid approach provides financial security while optimizing revenue potential across different market conditions.
What Factors Influence Bounce House Rental Pricing?
How Do Inflatable Categories Impact Pricing?
Classic bounce houses represent 38% of market share and remain the largest equipment segment in the rental industry. These standard units cost between $1,395 and $2,995 for commercial-grade equipment and serve as foundational inventory for most rental businesses. Their widespread availability creates competitive pricing pressure, with typical 4-hour rentals ranging from $150 to $200.
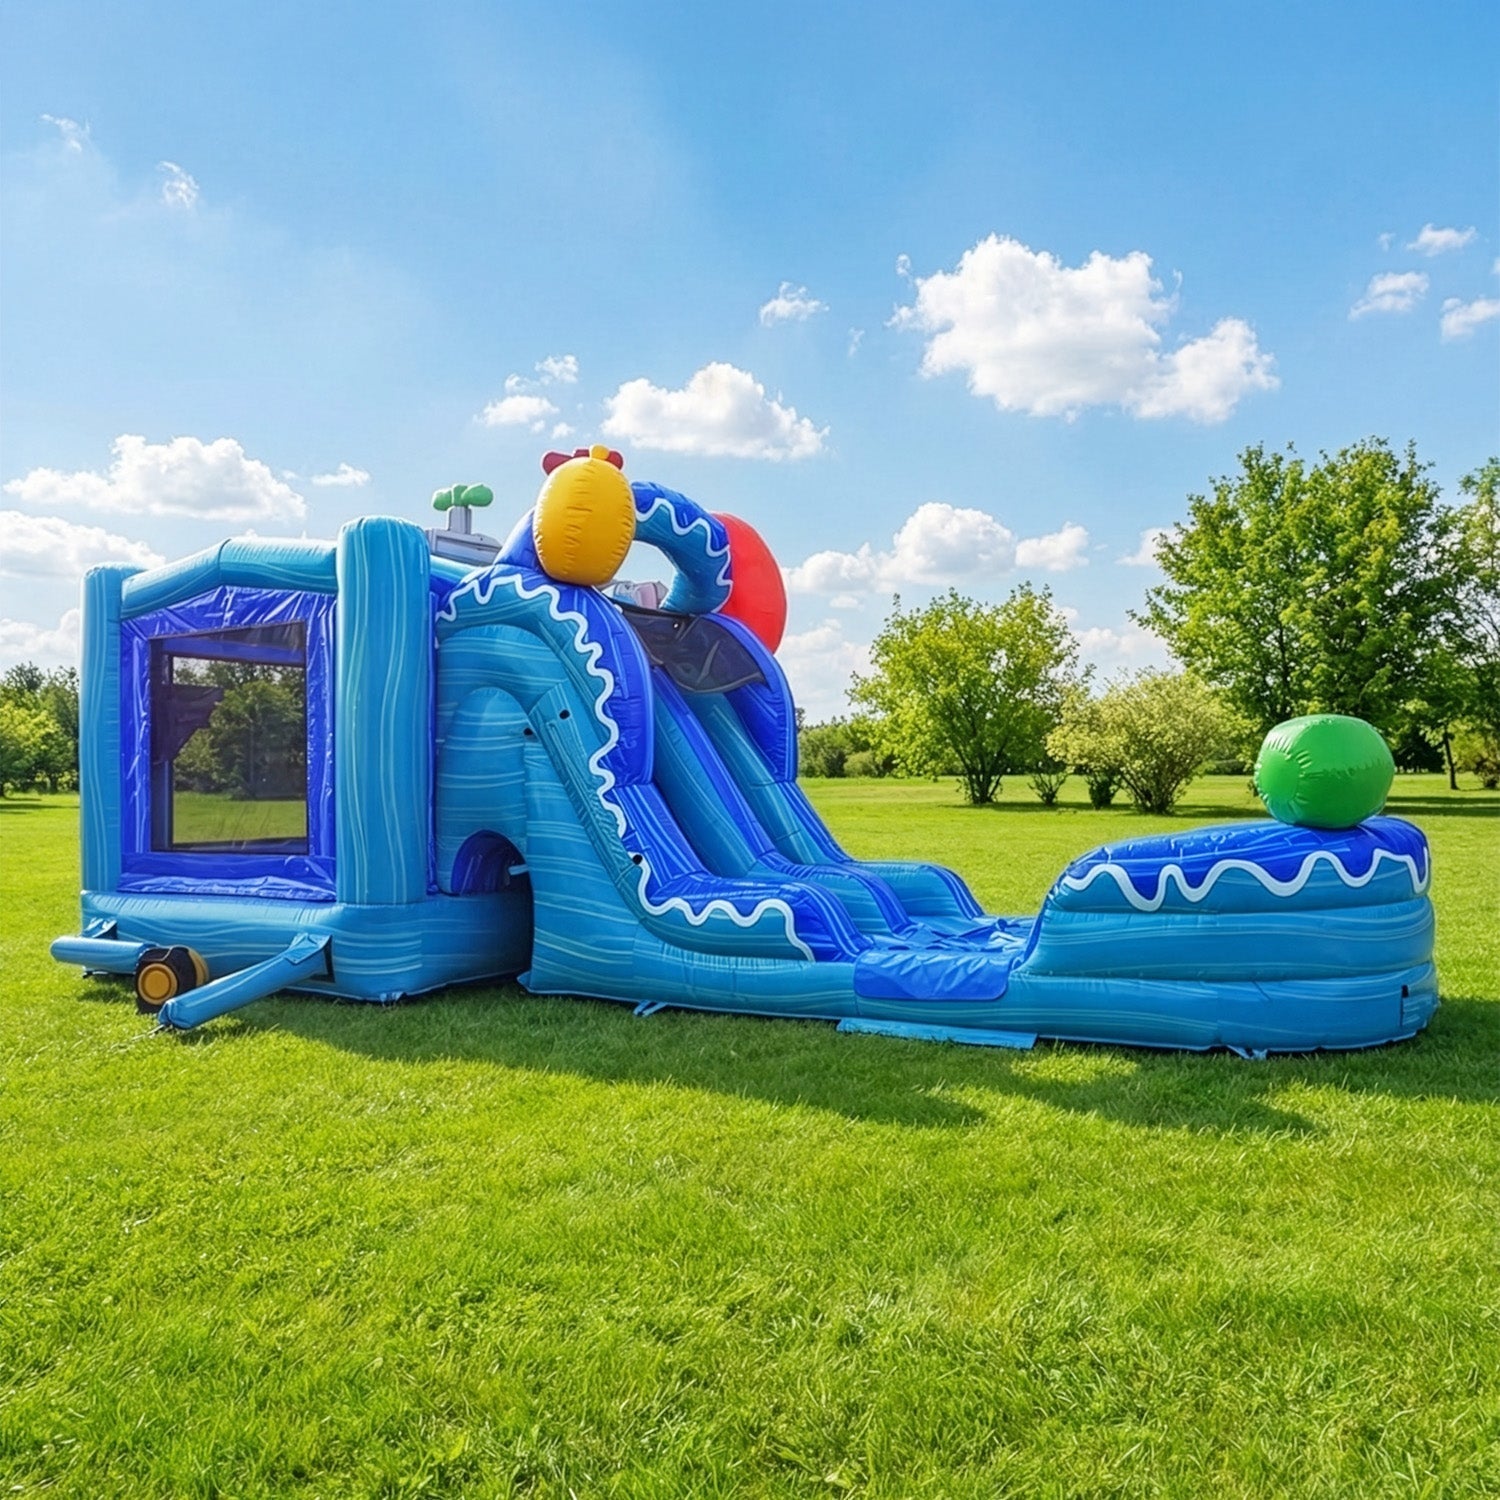
Bounce houses with slide combos account for 28% of market share and command higher rental rates due to enhanced entertainment value. Equipment costs for combo units range from $2,400 to $4,700, reflecting additional features like integrated slides and climbing walls. Obstacle courses capture 18% of market share and generate premium pricing, with 4-hour rentals typically priced between $300 and $400.
What Role Do Consumer Preferences and Demographics Play?
The 4 to 8-year age group represents 44% of market demand and drives rental volume for classic bounce houses. Children above 8 years account for 38% of the market share and prefer challenging obstacle courses with competitive elements. The up to 4 years demographic comprises 18% of the market demand and requires specialized units with enhanced safety features.
Understanding market segmentation by age allows operators to optimize inventory investment and pricing strategies. Equipment targeting the largest demographic segment generates consistent booking frequency but faces competitive pricing pressure. Units serving older age groups command premium rates due to specialized features and lower market saturation.
How Does Seasonality Affect Rental Rates?
Peak season during Q2 and Q3 generates 75% of annual rental expenses and the majority of revenue. Water slide rentals produce 40% higher revenue during summer months compared to standard bounce houses. This concentration of demand creates opportunities for premium pricing on high-value equipment from May through August.
Off-peak periods require strategic rate adjustments to maintain booking frequency without sacrificing profitability. Operators reduce rates moderately during slower months while focusing operational efforts on equipment maintenance and winterization rather than aggressive discounting. Price elasticity analysis reveals that excessive rate cuts during off-season rarely generate sufficient additional bookings to offset reduced per-rental margins.
How Are Operational and Hidden Costs Managed in Pricing?
What Are the Common Hidden Costs for Inflatable Rental Operators?
Research shows 72% of new inflatable rental businesses underestimate operational costs by 30-40% during initial planning. Hidden expenses ranging from $15,000 to $25,000 annually create cash flow challenges for operators who base pricing solely on equipment costs. Storage facilities require $400-$800 monthly for climate-controlled space that prevents mold and material degradation.
Digital infrastructure costs between $150 and $500 monthly for booking software, payment processing, and marketing platforms. Additional delivery fees of $50-$150 per rental must cover fuel, vehicle maintenance, and driver time. These recurring expenses directly impact minimum viable pricing thresholds that ensure sustainable operations.
How Do Maintenance, Insurance, and Storage Affect Pricing Strategies?
Commercial liability insurance costs between $2,400 and $6,000 annually for standard coverage limits required by most venues. Maintenance and repair expenses run $500-$1,500 quarterly for commercial-grade inflatables subjected to regular use. Transportation fleet maintenance requires $2,500-$5,000 annually for delivery vehicles handling repeated equipment loading and unloading.
Operators must incorporate these fixed costs into pricing calculations regardless of booking volume. A rental business generating 200 annual bookings distributes $25,000 in hidden costs across each event, adding $125 to the true cost per rental. Understanding insurance requirements and operational expenses prevents underpricing that appears profitable on paper but generates insufficient margins to sustain long-term operations.
What Is the Impact of Tax Benefits and Depreciation on Cost Calculations?
Section 179 deduction allows operators to deduct the full purchase price of qualifying equipment in the year placed in service. The maximum deduction reaches $1,220,000 for 2024, providing immediate tax relief on new equipment purchases. Bonus depreciation permits a 60% first-year deduction in 2024 for purchases exceeding Section 179 limits, declining to 40% in 2025.
MACRS depreciation classifies commercial bounce houses as 5-year property for tax purposes. Strategic use of depreciation schedules and tax benefits reduces effective equipment costs and improves cash flow for reinvestment. Operators applying Section 179 deductions to a $25,000 equipment purchase generate immediate tax savings that lower true acquisition costs by 20-30% depending on tax brackets.
How Can a Bounce House Pricing Calculator Improve Rate Setting?
What Inputs Should Be Included in a Pricing Calculator?
A comprehensive pricing calculator requires equipment purchase price, estimated annual rental frequency, and all operational costs. Maintenance expenses, insurance premiums, storage fees, and delivery costs must be quantified for accurate margin calculation. Depreciation schedules and tax benefit projections help operators understand true equipment costs over multi-year ownership periods.
Market research inputs including competitor rates, seasonal demand patterns, and target profit margins complete the calculation framework. Geographic factors such as population density, average household income, and local event frequency affect pricing viability. Integrating startup cost projections with ongoing operational expenses provides realistic financial models that guide sustainable rate setting.
How Does the Calculator Balance Cost-Plus and Value-Based Elements?
Effective calculators establish minimum rates using the cost-plus methodology to ensure expense coverage. Base calculations add equipment depreciation, operational costs, and target profit margins to determine break-even pricing floors. This foundation prevents underpricing that leads to unsustainable operations despite high booking volumes.
Value-based adjustments layer onto cost-plus foundations through competitor analysis and demand modeling. Calculators incorporate seasonal multipliers, equipment category premiums, and event type modifiers that capture market willingness to pay. The resulting pricing structure protects profitability while optimizing revenue across different rental scenarios and market conditions.
What Are the Benefits of Using a Pricing Calculator for Rental Markets?
Systematic pricing tools eliminate guesswork and emotional decision-making that leads to inconsistent rates. Operators gain confidence in their pricing structure through data-driven analysis of costs and market conditions. Well-managed operations using structured pricing approaches achieve gross profit margins between 40-60% compared to ad-hoc pricing methods that typically generate lower returns.
Calculators enable rapid scenario testing for new equipment purchases and market expansions. Rental businesses evaluate potential return on investment before committing capital to additional inventory. This analytical approach supports strategic growth decisions and helps operators identify which equipment categories and pricing strategies generate optimal profitability for their specific market conditions.
When Should Operators Choose Cost-Plus Pricing vs Value-Based Pricing?
In Which Scenarios Does Cost-Plus Pricing Provide Stability?
New operators without established competitor intelligence benefit from cost-plus pricing during initial market entry. This approach guarantees cost recovery while building customer bases and understanding local demand patterns. Fixed markup percentages simplify rate setting when operators lack historical booking data for informed market analysis.
Rural markets with limited competition support cost-plus strategies due to reduced pricing pressure. Geographic isolation creates natural barriers to competitive undercutting, allowing operators to maintain stable margins based on cost recovery. Markets with predictable demand and limited seasonal variation also favor cost-plus approaches that prioritize consistency over dynamic optimization.
When Is Value-Based Pricing More Profitable?
Competitive urban markets reward value-based pricing through premium capture during high-demand periods. Operators with multiple equipment types can price discriminate based on unit features, rarity, and appeal to different demographics. Peak weekend bookings during summer months present optimal opportunities for value-based premiums that exceed cost-plus calculated rates.
Corporate events and large-scale celebrations justify premium pricing that reflects perceived value rather than equipment costs. Customers booking obstacle course rentals for company picnics or community festivals prioritize entertainment quality over price sensitivity. These scenarios allow operators to maximize margins through value-based positioning that emphasizes unique features and exceptional service.
How Can Operators Strategically Combine Both Models?
Hybrid pricing establishes cost-plus floors that ensure minimum profitability across all bookings. Operators then apply value-based premiums when market conditions support higher rates without losing bookings to competitors. This dual-layered approach provides downside protection while capturing upside revenue opportunities.
Dynamic pricing adjustments based on booking lead time exemplify a successful hybrid implementation. Early reservations receive moderate value-based premiums, while last-minute availability discounts toward cost-plus minimums to fill scheduling gaps. Combo unit pricing strategies benefit particularly from this flexibility, allowing premium positioning during peak demand while maintaining competitive rates during slower periods.
How Do Market Dynamics and Competition Affect Pricing Strategies?
What Is the Influence of Regional Market Differences?
Asia Pacific accounts for 37% of total global revenue in the bounce house market. North America holds 31% of the global market share, with the US bounce house segment growing at 3.8% annually. Regional differences in disposable income, cultural event preferences, and competitive density create varied pricing environments that require localized strategies.
Urban markets with high population density support multiple rental operators and create competitive pricing pressure. Suburban and rural areas with limited provider options allow individual operators greater pricing flexibility. Geographic analysis helps operators identify underserved markets where value-based premiums remain viable without triggering competitive undercutting.
How Do Competitor Pricing and Market Growth Trends Shape Rates?
The global bounce house market reached USD 4.2 billion in 2024 and is projected to reach USD 6.2 billion by 2034. The broader party supply rental market, valued at USD 15.2 billion in 2023 expands to USD 32 billion by 2030. This growth creates opportunities for premium positioning as expanding markets support multiple price tiers and specialized service offerings.
Market growth at a 4.1% CAGR indicates sustained demand that supports gradual rate increases. Operators monitoring competitor pricing identify opportunities to lead market rate adjustments upward during high-growth periods. Price leadership strategies work best when coupled with service differentiation that justifies premium positioning relative to budget-focused competitors.
How Do Customer Priorities Like Safety and Quality Influence Pricing?
Safety compliance and equipment quality rank as top consumer priorities above price considerations. Parents and event organizers willingly pay premium rates for well-maintained commercial-grade equipment with visible safety certifications. This priority hierarchy creates pricing power for operators emphasizing equipment quality and comprehensive insurance coverage.
Reliable service delivery including punctual setup, professional communication, and flexible booking processes justifies value-based premiums. Operators competing solely on price face margin compression and customer bases focused on lowest cost rather than best value. Strategic positioning around safety, quality, and service excellence supports sustainable premium pricing that generates higher per-rental profitability than volume-focused discount approaches.
What Are the Best Practices for Implementing Pricing Strategies?
How to Adjust Pricing Based on Equipment Type and Demand?
Classic bounce house 4-hour rentals typically price between $150 and $200, with full-day rates reaching $200-$300. Bounce house with slide combo 4-hour rentals range from $200 to $300, extending to $300-$450 for full-day bookings. Obstacle course rentals command premium 4-hour rates between $300 and $400 due to specialized appeal and larger footprints.
Equipment-specific pricing reflects both acquisition costs and market demand characteristics. Operators adjust rates higher for units with limited local availability and lower for oversaturated equipment types. Seasonal pricing modifiers increase rates 20-40% during peak summer months while offering modest discounts during winter to maintain off-season booking momentum.
What Role Does Customer Service and Convenience Play in Pricing?
Premium service delivery justifies value-based pricing that exceeds competitor rates for equivalent equipment. Easy online booking systems, flexible payment options, and responsive communication reduce customer friction and support higher willingness to pay. Professional setup procedures with thorough safety briefings create perceived value that extends beyond physical equipment rental.
Convenience factors including flexible delivery windows, same-day availability, and accommodating cancellation policies differentiate premium operators from budget competitors. Customers prioritizing stress-free event planning accept higher rates in exchange for reliable service and operational flexibility. Service-based differentiation proves more sustainable than equipment-based differentiation, as competitors can replicate inventory more easily than operational excellence.
How Can Operators Leverage Pricing Strategies for Profitability?
Successful operators maintain a 3:1 ratio between operational budget and equipment investment during the first year. Establishing operational reserves covers unexpected expenses and seasonal cash flow variations without requiring emergency rate discounting. This financial discipline ensures pricing decisions optimize profitability rather than react to immediate cash needs.
Strategic budget allocation assigns 75% of annual expenses to peak season quarters when booking volume justifies increased operational capacity. Off-peak periods focus on equipment maintenance and repairs rather than revenue generation through unsustainable discounting. Operators utilizing Section 179 deductions for immediate tax relief on new equipment purchases improve cash flow for operational reserves and strategic reinvestment.
Bounce House Pricing Calculator: Integrating Cost-Plus and Value-Based Pricing for Sustainable Rental Business Success
Effective pricing strategies combine cost-plus foundations with value-based adjustments that capture market opportunities. Operators who systematically analyze equipment costs, operational expenses, and competitive dynamics build sustainable businesses with 40-60% gross profit margins. The integration of structured pricing calculators eliminates guesswork and supports confident rate setting across diverse equipment types and market conditions.
Long-term profitability requires balancing minimum viable pricing floors with dynamic market responsiveness. Rental businesses applying hybrid approaches maintain financial stability during slow periods while maximizing revenue during peak seasons. JumpOrange provides commercial-grade equipment and business resources that help rental entrepreneurs build profitable operations through strategic pricing and operational excellence.
Whether establishing initial rates or optimizing existing pricing structures, operators benefit from data-driven analysis and market-informed adjustments. The bounce house rental industry rewards businesses that understand true operational costs, monitor competitive positioning, and deliver exceptional customer experiences.
Price With Confidence. Profit With JumpOrange.
Smart pricing only works when your equipment can back it up. JumpOrange builds commercial-grade inflatables made to survive peak-season demand and keep earning year after year, so the rates you set actually translate into margins you keep. From classic bounce houses to combo units and obstacle courses, our lineup gives you the quality customers will pay a premium for and the reliability that protects your reputation.
Ready to build a rental business with pricing power on your side? Explore the JumpOrange collection of durable bounce house water slide rental solutions or talk with our team about equipment and strategies that fit your market and your growth goals. Join the JEM Club and get exclusive discounts, free shipping on qualifying orders, and expert support that helps every rental pay off.


Leave a comment
This site is protected by hCaptcha and the hCaptcha Privacy Policy and Terms of Service apply.